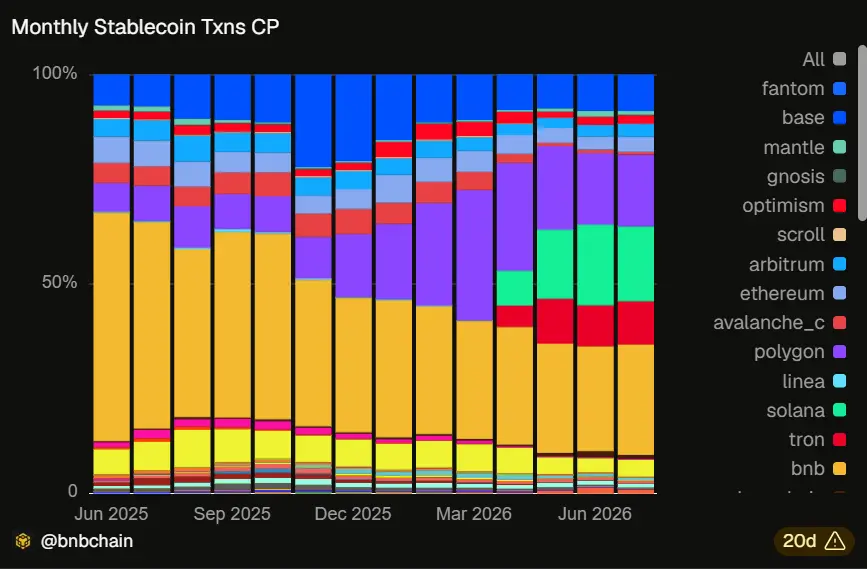
In a significant shakeup for decentralized finance (DeFi) infrastructure, BNB Chain is experiencing a notable loss of market share in monthly stablecoin transaction volume, falling from comfortably dominating more than half of the market to standing at 26.3% by mid-2026. According to on-chain data extracted from @bnbchain’s official Dune Analytics dashboard, the growing adoption of ecosystems like Solana and Polygon fragmented a sector where speed and transaction costs dictate the rules of the game.
The Plunge in Numbers: From Hegemony to Shared Dominance
Historical analysis of the “Monthly Stablecoin Txns CP” chart reveals a structural shift in user and institutional preferences. In mid-2025, BNB Chain held a dominant position, routing the vast majority of stablecoin transactions with USDT and USDC. However, by January 2026, the metric reflected a steady erosion in its market share, dropping to 32.7%, while rivals like Polygon rose to 17.9% and Base reached 15.6%.
This trend did not stop in the first quarter. In the most recent reading for July 2026, the monthly distribution of stablecoin transaction volume has diversified dramatically:
BNB Chain (BNB): 26.3%
Solana: 17.8%
Polygon: 17.0%
Tron: 10.3%
Base: 8.7%
Celo: 4.1%
Ethereum: 3.6%
Arbitrum: 3.1%
Why Is Liquidity Shifting Direction?
Millennial and Gen-Z Web3 user behavior responds directly to three pillars: settlement speed (latency), scalability, and network costs (gas fees).
Ecosystems like Solana (17.8%) and Polygon (17.0%) managed to capture massive capital flows thanks to strategic integrations into payment gateways, lending protocols, and P2P payment applications. Meanwhile, Ethereum Layer-2 networks (L2) such as Base (8.7%) and Arbitrum (3.1%), along with specialized mobile payment chains like Celo (4.1%), continue to absorb microtransactions that Binance Smart Chain previously processed.
To rephrase the metric: capital is not leaving the stablecoin market; rather, it is redistributing into cross-chain infrastructure optimized for real-world use cases (Real World Assets or RWA and retail payments).
BNB Chain’s loss of transaction monopoly marks a new era of multi-chain maturity. In the short to medium term, the crypto ecosystem will witness fierce competition for liquidity; networks that manage to maintain near-zero fees and seamless interoperability will dominate the global settlement of digital assets.
Disclaimer: This article is strictly for informational and educational purposes. It does not constitute investment advice or a financial recommendation. Always do your own research (DYOR) before trading in the crypto market.

Communications Professional. Crypto Enthusiast. Economic Journalist. Bitcoiner & Altcoiner.