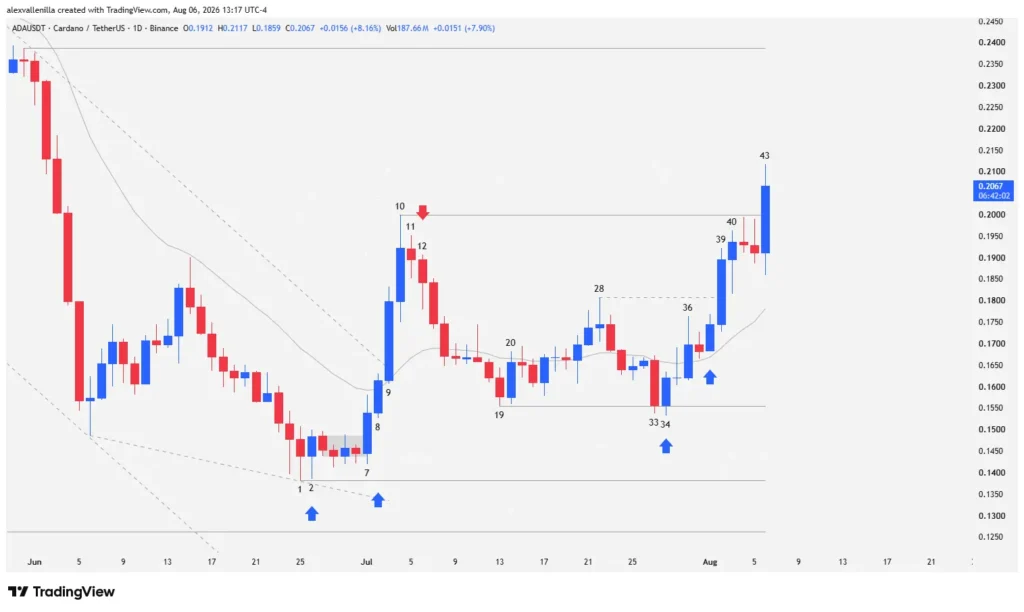
In a convincing display of supply absorption and institutional accumulation, Cardano (ADA) executes a market structure shift on the daily (1D) timeframe. After printing a swing low in the $0.1382 zone and consolidating a double bottom formation, the cryptocurrency broke aggressively above the 20-period exponential moving average (EMA 20) and cleared key resistance at $0.20. Driven by high-conviction bullish bars over recent sessions, this move threatens to end a macro downtrend of over 600 bars and projects direct targets toward the critical $0.2388 level.
Narrative Shift: From Stagnation to a Multi-Impulse Breakout
The digital asset market puts Cardano back in the spotlight for the trading community. For weeks, the cryptocurrency languished in a secondary 54-bar descending channel, which squeezed volatility inside a falling wedge at the bottom of a macro downtrend exceeding 600 candles.
However, supply’s inability to push price toward deeper historical support levels—such as the $0.123 zone, untested in over 2,000 bars—generated a crucial psychological divergence. Buyers capitalized on the exhaustion of selling momentum to defend strategic levels, articulating a sequence of higher lows that culminated in an active breakout of local resistance.
Detailed Technical Analysis: Bar-by-Bar Breakdown (Pure Price Action)
The daily Cardano chart reveals the underlying psychology between supply and demand, meticulously broken down bar-by-bar through order flow:
Phase 1: Bottom, Absorption, and the Initial Signal (Bars 1 to 2)
Bar 1: Price finds initial support at $0.1382. Its low falls short of extreme historical support at $0.123 (untested in 2,052 bars), marking the lowest point of this period. This candle outlines the lower boundary of a falling wedge within a secondary 54-bar downtrend. The body fully overlaps the previous candle, fails to close below the prior low, and shows a pronounced lower tail that evidences aggressive supply absorption.
Bar 2: Prints an identical low to Bar 1, forming a Tweezer Bottom reversal pattern. As a slight inside hammer bar, it halts the slide. The accumulation of lower tails across previous bars forms strong buying pressure, signaling the first bullish indication within the macro downtrend.
Phase 2: EMA 20 Breakout and Dynamic Shift (Bars 7 to 10)
Bar 7: Buyers break out above the prior micro-congestion range. Although its high fails to test the EMA 20 directly, accelerating volatility generates a bullish signal awaiting confirmation.
Bar 8: Confirms the breakout. It takes out the high of Bar 7 and positions above the EMA 20, a moving average price had failed to touch for 49 bars. This officially signals the potential exhaustion of the 54-candle secondary downtrend and opens a discount buying entry.
Bar 9: Institutional capital takes control, printing a wide-range, high-conviction bullish bar with virtually no lower tail. It breaks the upper boundary of both the mini descending channel and the falling wedge. As the third consecutive and most aggressive bullish impulse, it qualifies as a climax bar, increasing the probability of an imminent pullback.
Bar 10: Extreme volatility halts the advance. Prominent tails appear at both ends (highlighting the upper tail), evidencing fierce profit-taking and establishing local resistance at $0.2000.
Phase 3: The Bull Trap and Double Bottom Construction (Bars 11 to 34)
Bar 11: An inside bar marks the end of the first impulse via a final flag, trapping impatient buyers who entered on FOMO.
Bar 12 to 14: Bar 12 breaks the low of Bar 11, triggering a cascading pullback that drags price back below the EMA 20 into Bar 14.
Bar 19: Bears attempt to restart the trend by dropping below the EMA 20, but the candle remains small and finds solid support at $0.1554, printing a higher low relative to Bars 1 and 7.
Bar 20: Immediate bullish reversal. Weakness in the last three bearish closes attracts buyers, initiating a new congestion overlap with the EMA 20.
Bar 28: After attempting to regain control, bulls print a Doji. Although it closes above the EMA 20, multiple tails and a completely flat EMA attract supply. Bars 29 and 30 confirm the pullback below the EMA 20, setting a lower high relative to Bar 10.
Bar 33 and 34: Sellers launch a high-conviction candle (Bar 33) but fail to close below support at Bar 19. Bar 34 reacts with an immediate reversal that invalidates the drop and confirms a double bottom pattern relative to Bar 19, drawing defensive buying flow.
Phase 4: Bullish Structure and the Attack on Resistance (Bars 36 to 43)
Bar 36: Confirms the double bottom by closing back above the EMA 20, though the upper tail indicates persistent seller resistance.
Bar 39: Buyers defend higher low support. Following a failed pullback in Bar 37 and confirmation in Bar 38, Bar 39 erupts as a high-conviction institutional candle that cleanly breaks the high of Bar 28.
Bars 40 to 42: Mild two-candle consolidation. Bears try to stall the advance at Bar 10 resistance, but manage only narrow-range, high-volatility bars, exposing the weakness of the counterattack.
Bar 43 (Current Developing Bar): A strong conviction outside bar traps premature sellers and breaks the high of Bar 10 in real time. This price action confirms a clean higher-low structure (Bar 34 over Bar 19, and Bar 19 over Bar 1) and clears the path to test key resistance at $0.2388.
Technical-Operational Structure:
Historical Low / Base: $0.1382 (Bar 1)
Secondary Support (Double Bottom): $0.1554 (Bars 19 and 34)
Cleared Intermediate Resistance: $0.2000 (Bar 10 / Bar 43)
Technical Target / Macro Resistance: $0.2388
Short-Term Cardano Outlook
The breakout in Bar 43 is no isolated event: it marks the culmination of a methodical accumulation process conducted by institutional capital over the last 42 sessions. Projecting a measured move from the initial impulse (Bar 1 to Bar 10) after clearing the $0.20 ceiling, mathematical probabilities favor an imminent test of the $0.2388 resistance zone. If ADA consolidates a daily close above this level, it will structurally invalidate the prior downtrend, kicking off a larger recovery phase for the ecosystem.
Disclaimer: The content of this article serves purely informational and educational purposes regarding technical analysis and price action. It does not constitute, nor should it be interpreted as, investment advice, financial recommendations, or a solicitation to buy or sell digital assets. Cryptocurrencies are highly volatile assets. Conduct your own research (DYOR) and consult a certified financial advisor before making investment decisions.

Communications Professional. Crypto Enthusiast. Economic Journalist. Bitcoiner & Altcoiner.