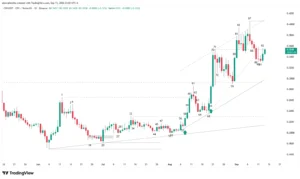
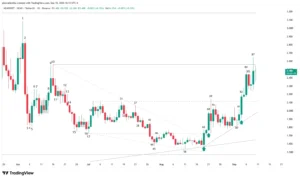
The digital asset ecosystem witnesses a critical movement in Ripple’s (XRP) price action. After piercing the bearish trendline that governed its long-term macro structure, the asset currently debates between consolidating a new accumulation range and the selling pressure that threatens to invalidate key supports established on the daily chart (1D).
Price Anatomy: X-Ray of Price Action on the Daily Chart
XRP’s current structure defines itself from a precise sequence of bars reflecting the constant struggle between institutional supply and retail demand.
The Genesis of the Range: From Bar 1 to Bar 9
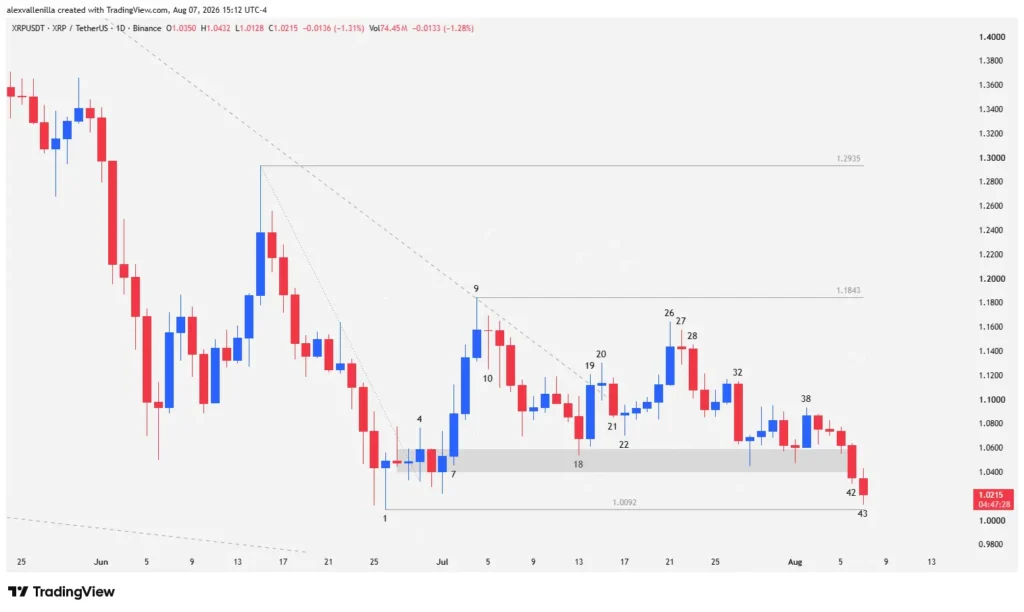
The recent cycle starts at Bar 1, where the end of a two-legged bearish move within a 360-bar macro trend converges. This hammer candle, featuring a deep lower wick, aggressively absorbs selling liquidity and establishes a fundamental support at $1.0092, after registering a low unseen in 630 bars.
Following a micro-range compression phase, Bar 4 breaks the short-term bearish trendline (14 bars), allowing buyers to drive the price up to Bar 9. At this point, XRP tests the main 360-bar bearish trend line. The rejection is evident: a wide upper wick prints, setting a strict resistance at $1.1843, officially bounding a trading range between this level and $1.0092 of Bar 1.
The Breakout Failure and the Bar 26 Trap
The bullish momentum resumes after a two-legged pullback toward the extended congestion zone (identified from Bar 2). Bar 19, a wide-range and high-conviction candle, slightly pierces the long-term trendline, suggesting strong hands entering a potential accumulation zone. However, Bar 20 (doji type) evidences a remarkably weak breakout incapable of surpassing the previous high.
The bullish push culminates in Bar 26, an extended-body climatic bar that attempts to break the $1.1843 resistance. As the final acceleration bar, it inevitably attracts profit-taking. This confirms in Bar 27, an inside bar (doji) trapping late buyers and acting as a failed bull flag, setting the stage for the bearish offensive.
The Bearish Offensive and the Bar 42 Climax
Institutional sellers lash out heavily in Bar 32, a firm-conviction bearish bar sweeping away late buyers from bars 30 and 31. Although bulls attempt a tactical counterattack in Bar 38 (leveraging prior congestion support), Bar 39 (bearish inside bar) neutralizes the attempt.
The bearish outcome crystallizes in Bar 42, an acceleration bar with an upper body larger than its predecessors (40 and 41), qualifying as a climatic move that violently breaks the congestion zone and breaches previous lows. Finally, Bar 43 (in development) extends the current drop, showing a small body suggesting selling pressure fatigue as it dangerously approaches the definitive test of the baseline support at $1.0092.
Structural Context: Accumulation or Descent Toward New Lows?
Technically, XRP price successfully escapes a 278-bar descending wedge formation, a classic signal of compression and exhaustion of the prior downtrend. However, the 360-bar macro-trend breakout does not guarantee an immediate bullish reversal; the market transitions into a peak and range structural pattern.
Bullish Scenario (Range and Accumulation): If buyers successfully defend the precise support at $1.0092 (Bar 1 low), a clear operating range consolidates with a ceiling at $1.1843. To trigger a medium-term bullish structure, bulls must break the last relevant high located at $1.2935 with institutional volume.
Bearish Scenario (Support Invalidation): If the selling pressure of Bar 42 and 43 decisively pierces $1.0092, the path remains clear to visit the historical support located at $0.9393 (former resistance from 1,123 bars ago and key support from 630 bars ago). If this barrier yields, the asset exposes itself to a deep reassessment of structural lows.
XRP price action sits at a high-tension technical crossroads. The long-term bearish trendline breakout suggests a latent shift in market bias, but the inability to sustain bullish pushes demonstrates that supply still controls tactical timing. The precise defense of the $1.0092 support determines whether we face a healthy institutional accumulation zone or the prelude to a deeper correction toward the $0.9393 zone. Operational discipline and strict order flow reading in upcoming sessions prove vital to defining directional bias.
Disclaimer: This article serves exclusively educational and informational purposes and does not constitute financial or investment advice. The cryptoasset market presents high volatility and risk of capital loss. Always perform your own research (DYOR) before executing any trade in financial markets.

Communications Professional. Crypto Enthusiast. Economic Journalist. Bitcoiner & Altcoiner.