The native token of the Ethereum Layer 2 Arbitrum (ARB) experiences a critical phase on its daily chart during this market cycle. Following a prolonged 51 percent drop from $0.1495, the price finds an institutional defense zone at $0.0705. Backed by strong hands’ volume and a bearish right-triangle compression, the asset defines its technical direction between institutional accumulation and the threat of new lows.
X-ray of a Drop: Bearish Capitulation and Historical Support
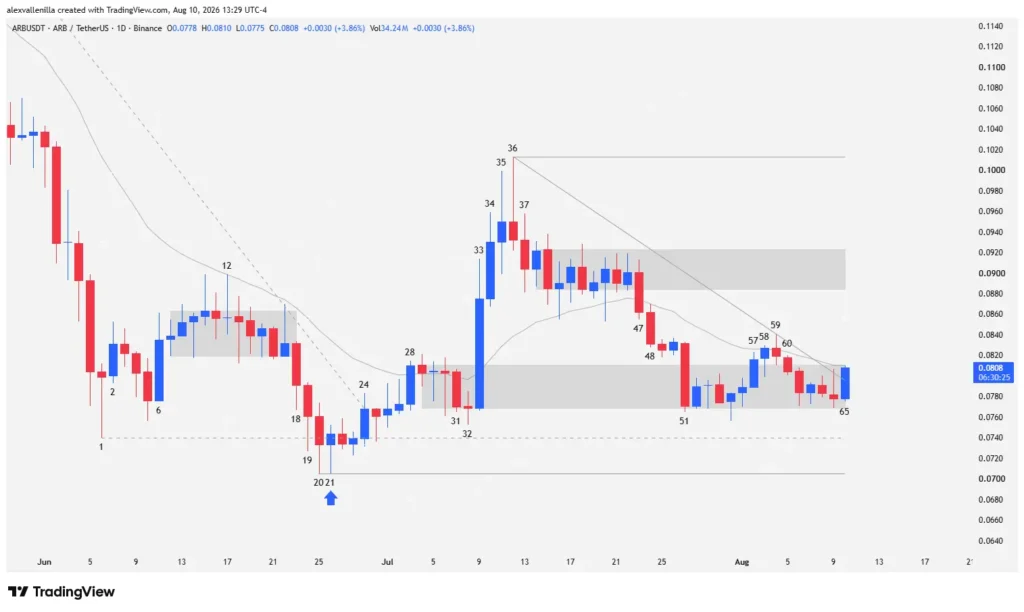
ARB‘s price action began to deteriorate after a classic bull trap that triggered a strong 51-bar downtrend. This initial impulse led the asset to mark a historical low at bar 1 at $0.074, where a capitulation bar with a long lower wick reflected the first major supply absorption by institutional buyers.
Repeated bearish attacks failed to break this critical level. At bar 21, the formation of a twezzer bottom set a new support at $0.0705. The large lower wicks of bars 18, 19, and 21 demonstrated constant buying pressure that halted bearish continuation and prepared the ground for a larger-scale reaction.
The Turning Point: The Influx of Strong Hands
Market balance changed radically at bar 33, when massive institutional capital inflow materialized a high-conviction, wide-range candle with a minimal lower wick. This impulse broke the previous bearish structure and cleanly cleared the 20-period Exponential Moving Average (EMA 20), finding continuation at bar 34.
However, bullish momentum stalled at bar 36, establishing a new ceiling at $0.1013. From that moment, sellers structured a second corrective leg that culminated at bar 51, where a new capitulation climax confirmed that strong hands actively defended the low zone through systematic accumulation.
Current Technical Scenario and Outlook
In recent sessions, the price draws a descending right-triangle compression, bounded by a 29-bar bearish trendline that presses highs against the range floor.
Bar 65 tests the EMA 20 and seeks to invalidate the short-term bearish guideline. To confirm a bullish structural reversal, buyers must overcome the congestion zone located around $0.09 and challenge the bar 36 high at $0.1013. Conversely, a loss of the supports at $0.074 and $0.0705 invalidates the accumulation thesis and opens the door to uncharted territory.
Arbitrum’s price action evidences a classic institutional accumulation phase where strong hands discipline historical floors. The market’s ability to overcome immediate resistances defines whether the asset consolidates a sustainable bullish reversal pattern in the medium term.
Disclaimer This article is for educational and informational purposes only and does not constitute financial advice of any kind. Cryptocurrency trading carries a high risk of capital loss; conduct your own research before trading the markets.

Communications Professional. Crypto Enthusiast. Economic Journalist. Bitcoiner & Altcoiner.