The Uniswap (UNI) market stands at a decisive inflection point. After completing an impressive 97.27% rally from the $2.316 lows, buyers slammed into an insurmountable institutional wall at the key $4.588 resistance level. Price action on the daily chart reveals how FOMO psychology trapped bulls in a sophisticated bull trap, triggering a two-leg pullback that is now testing the main channel’s structure. Are we witnessing the precursor to a new medium-term cycle, or the resumption of bearish dominance?
Anatomy of the Breakout and the Buying Climax
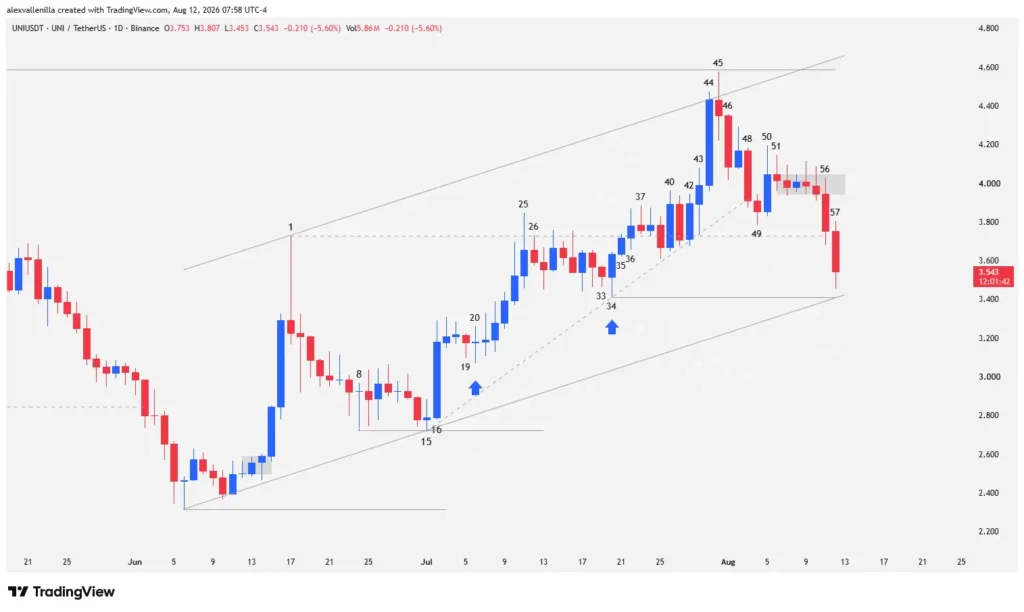
UNI‘s daily rally gained momentum when institutional capital took operational control at Bar 40, printing a high-conviction candle that pierced resistance at $3.729 (the Bar 1 high). Despite a reversal attempt by the bears, buyers fought back at Bar 42, defending the broken level as new support and trapping the Bar 41 sellers. This absorption tactic protected the secondary trendline of the micro-bull channel that began at Bar 15 and was anchored by the Bar 34 low.
With confirmation at Bar 43, the market unleashed a parabolic surge at Bar 44. Bulls surged with a wide-range, high-volume candle featuring almost no wicks, testing the top of the larger 68-bar bull channel. However, this momentum concealed a technical vulnerability:
Bar 44 immediately registered as a climactic acceleration bar. By completing the second leg up from the Bar 15 lows at the top of the structure, it left bulls exhausted after massive buying depletion. Furthermore, this move compressed the micro-channel lows against the roof of the main channel, forming a rising wedge pattern—a classic technical setup warning of a sharp correction.
Price Action Technical Analysis: From the Bull Trap to the Wedge Breakdown
The rejection at the $4.588 structural resistance—a level marking the upper boundary of a 182-session sideways range—sparked a fierce battle between supply and demand.
Order Flow Transition
The rejection at Bar 45 triggered massive profit-taking that shifted the chart structure. Failing to consolidate above $4.588, the fakeout invalidated the immediate trend-reversal thesis.
Order flow turned heavily toward the sell side at Bar 46, where bears seized control right from the open. The formal breakdown below wedge support at Bars 48 and 49 confirmed the deterioration of the secondary trend. When bulls attempted to regain control at Bar 50, supply crushed the move, leaving a long upper wick that highlighted buyers’ inability to sustain higher prices.
The subsequent consolidation pattern between Bars 51 and 55 served as a redistribution pause. Finally, Bar 56 aggressively broke down from that range, driving price action to retest the polarity zone at $3.729.
Trade Scenarios and Future Outlook
The current correction from Bar 45 to Bar 57 developed a two-leg bearish structure, which technically represents a healthy pullback within the primary 68-bar bull channel. However, the market rests in a high-sensitivity zone that will define the medium-term bias.
Bearish Scenario (Continued Pressure): If supply maintains control and breaks below local support at $3.412 (the Bar 34 low) along with the channel’s dynamic support at $3.424, the entire 68-bar structure will be completely invalidated. This scenario opens the door to the next major support level at $2.725.
Bullish Scenario (Structural Defense): If buyers absorb selling pressure in the $3.412–$3.424 area—producing a reversal pattern or a failed bear flag following Bar 57—UNI could keep the primary bull channel intact. Nevertheless, any recovery attempt must clear the solid prior consolidation zone at $4.048 to mount another attack on the crucial $4.588 resistance.
Price action signals caution: until bulls build a solid base above dynamic support levels, supply will keep control of the order flow in the short term.
Uniswap’s recent price action illustrates textbook liquidation dynamics following a climactic acceleration. While losing the rising wedge confirms selling strength, bulls’ ability to defend the $3.412–$3.424 range will determine whether this slide is merely a necessary pause before another run at $4.588, or the start of a renewed bear cycle.
Disclaimer: This article is strictly for informational and educational purposes based on price action technical analysis. It does not constitute investment advice, financial planning, or an offer to buy or sell digital assets. Crypto assets carry high volatility; perform your own research before making trading decisions.

Communications Professional. Crypto Enthusiast. Economic Journalist. Bitcoiner & Altcoiner.