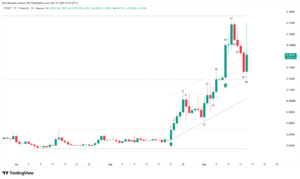
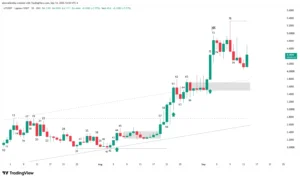
The STABLE cryptocurrency market faces a critical juncture on its daily timeframe (1D). After maintaining a solid ascending channel structure for 216 sessions, price action printed a sharp correction that broke the primary trendline. Sellers triggered this downward move after buyers failed multiple times to clear the resistance zone at $0.0406 and retest the all-time high of $0.0449.
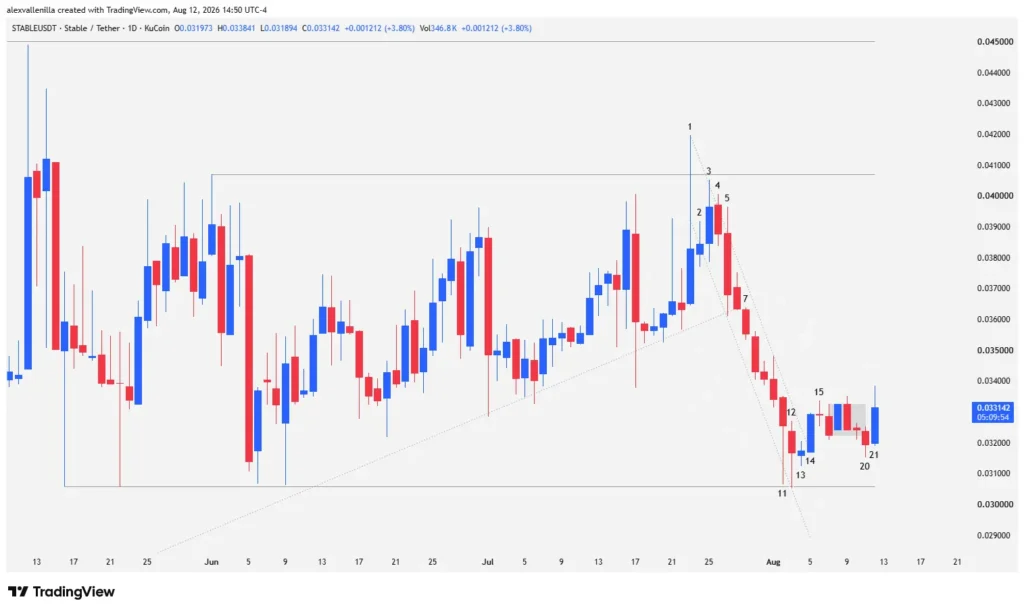
Sellers currently attempt to take absolute control of the order flow. However, price action around the key $0.0305 support shows signs of supply exhaustion, raising the possibility of a bear trap or the formation of a wide consolidation range before establishing its next macro direction.
Price Action Breakdown: From the $0.0406 Ceiling to Compression at $0.0305
Distribution Phase and Trend Breakdown (Bars 1 to 7)
The macro structure shows that after hitting the all-time high at $0.0449, the asset entered a deceleration phase. Higher lows compressed against horizontal resistance at $0.0406, forming an ascending right-triangle pattern whose resolution ultimately favored supply.
Bar 1: Represents the bulls’ third failed attempt to pierce resistance at $0.0406. Despite buying momentum, sellers aggressively rejected price, printing a massive upper tail substantially larger than the candle body. This high-volatility bar marked the end of bullish momentum within the 216-bar channel.
Bar 2: Acts as a consolidation inside bar. The inability to follow through on Bar 1’s bullish attempt confirmed indecision and a lack of demand at higher levels.
Bar 3: Buyers attempt another test toward resistance, but weak volume creates a lower high compared to Bar 1, showing clear exhaustion in buying momentum.
Bar 4: Bearish-bodied inside bar that traps late buyers from Bar 3, shifting the balance toward supply.
Bar 5: Selling pressure intensifies with a decisive push that pierces Bar 4 and the lower boundary of the primary 216-bar channel. Although the low breaks the trendline, the close stays right on the margin.
Bar 7: Following a brief pause on Bar 6, Bar 7 definitively confirms the breakout from the main ascending channel. From this point forward, price officially enters a tight bear microchannel.
Capitulation and Absorption at Key Support (Bars 11 to 13)
Bearish momentum pushed the asset toward its first structural support level from the previous trend, located in the $0.0305 area.
Bar 11: Serves as a climax or capitulation bar. It accelerates the move down, printing a hammer with an extended lower tail. This wick reveals massive supply absorption by institutional buyers who stepped in to defend the $0.0305 support.
Bar 12: Sellers try again to pierce the $0.0305 level but fail. The bar prints a pinbar-style candle with a prominent lower wick. Crucially, Bar 12 closes inside Bar 11’s range with its body completely overlapping, signaling a definitive loss of momentum in the selling drive.
Bar 13: Inside bar that halts the decline. By printing a higher low above Bar 12, it breaks bearish continuity and initiates a short-term consolidation phase.
Microchannel Breakout and Bear Trap (Bars 14 to 21)
Bar 14: Bulls react strongly, pushing above the high of Bar 13 to execute a breakout from the 13-bar bear microchannel drawn from Bar 1’s peak.
Bar 15: Prints a Doji that stalls bullish follow-through, causing a temporary breakout failure and trapping price in a four-session congestion micro-range.
Bar 20: Attempts to break down from the micro-range. However, it displays a very narrow range without selling conviction, and its low fails to even approach the $0.0305 support.
Bar 21 (Active Session): The current bar denies Bar 20’s bearish continuation, setting up a failed breakout that traps late sellers. Although the session remains open, price prints a higher low relative to Bar 12 and trades above Bar 20’s high, suggesting a failed recent pullback.
Structural Outlook: Price Action Scenarios
Market conditions currently show a technical bounce following the breakdown of the bear microchannel that ended on Bar 13. Support at $0.0305 holds firm, but the overall structure remains under the shadow of the 216-bar channel breakdown.
Bullish Scenario
To resume the macro bullish structure, buyers must confirm the reversal pattern at $0.0305 support and clear the $0.0406 zone. Note that this level now overlaps with the bottom of the former ascending channel, so it may act as resistance (level polarity). A strong close above $0.0406 opens the door to target the all-time high at $0.0449 once again.
Bearish or Sideways Scenario
If sellers regain control and force a clean breakdown below $0.0305, the correction will deepen toward the next major support and volume control zone at $0.0216. Otherwise, the asset could remain trapped in a sideways range bounded by the $0.0305 floor and the $0.0406 ceiling until a new catalyst emerges.
STABLE’s price action reflects a transition from a mature uptrend into a broad re-accumulation or distribution phase. Bullish defense seen on Bars 11, 12, and 21 proves that the $0.0305 zone holds substantial buying volume. Key execution hinges on Bar 21’s session close and the asset’s ability to break short-term immediate resistance.
Disclaimer: This article serves strictly educational and informational purposes based on price action analysis and does not constitute financial advice, investment recommendations, or an offer to trade. Cryptocurrency markets carry high volatility; conduct your own research (DYOR) before making investment decisions.

Communications Professional. Crypto Enthusiast. Economic Journalist. Bitcoiner & Altcoiner.