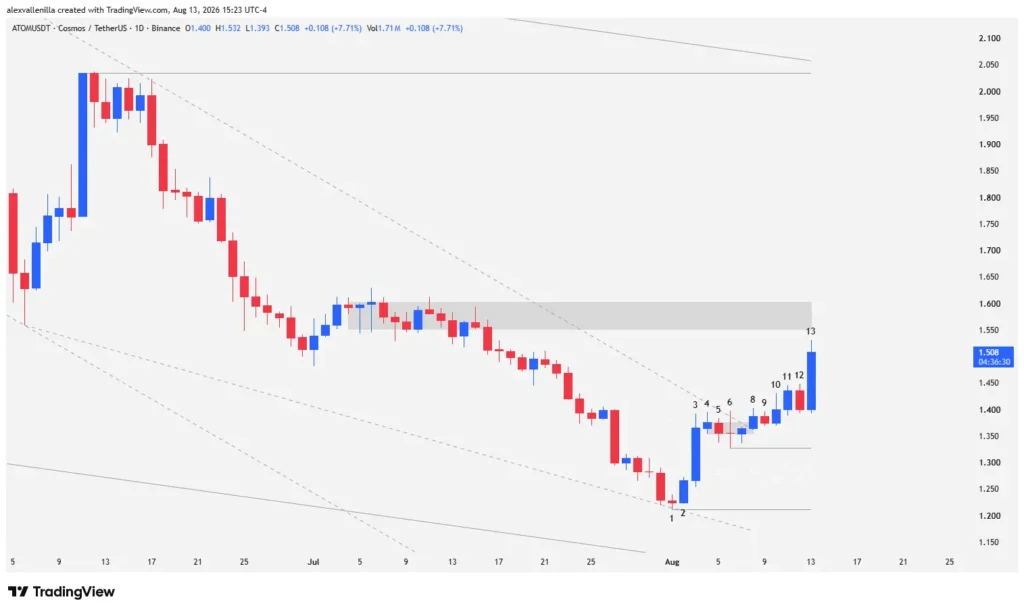
The Cosmos native token, ATOM, is executing a decisive reversal attempt within its daily (1D) market structure. Following an extended macro downtrend spanning 1,600 bars and a secondary acceleration of 211 bars, institutional capital stepped in to defend key support at $1.212. The confirmed breakout from a descending wedge now projects price directly toward a test of key magnet zones and critical resistance around the $1.55 level.
Macro Context: Bullish Relief Within Dominant Pressure
ATOM’s daily chart reveals a prolonged distribution structure accumulating 1,600 bars of grinding downside. Within this bearish ecosystem, price action compressed into a 211-bar secondary trend, where accelerating sell flow drove quotes to lows unseen in recent cycles.
However, across the final stretch of the last 74 bars, the market began flashing signals of sell-side exhaustion. This loss of momentum formed a descending wedge pattern—a structural exhaustion setup where converging lower highs and decelerating lower lows anticipate an eventual influx of buy-side liquidity.
Exclusive Technical Analysis: Bar-by-Bar Narrative and Price Psychology
Structural Floor and Institutional Awakening (Bars 1 to 3)
Bar 1 snaps the continuity of the prior climax move by printing a narrow-body doji. The low of Bar 1 establishes vital support at $1.212, an anchor level that marks the lower boundary of the descending wedge. Bar 2 reacts immediately: a bullish candle sweeps past the high of Bar 1, trapping late short-sellers in a liquidity sweep (bear trap).
Confirmation of the pivot arrives on Bar 3, an imposing high-conviction bar where smart money and institutional capital aggressively absorb floating supply at deep discount prices.
Compression and Barbwire Formation (Bars 4 to 7)
Despite the momentum behind Bar 3, Bar 4 and Bar 5 reflect buyers’ temporary inability to print a higher high, resulting in a tight trading range. Price enters a micro-congestion phase—a pattern known in price action methodology as barbwire.
Bar 6 confirms this indecision by printing tails on both ends (support at $1.327) while testing the upper bearish trendline of the 74-bar secondary channel for the first time.
Breakout Mechanics: From Failure to Master Impulse (Bars 8 to 13)
Bar 8: Attempts to break out of the descending wedge and the 74-bar resistance, but prints a low-volume, narrow-range bar that betrays a lack of follow-through.
Bar 9: Sellers force an inside consolidation bar, validating Bar 8 as a temporary breakout failure.
Bar 10: Volatility expands violently through an outside bar. Bulls win the session by closing above the high of Bar 9, executing a “failure of a failure” that clears the congestion, though a prominent upper tail indicates profit-taking at the highs.
Bar 11 and Bar 12: Bar 11 provides continuity to the upside by closing above Bar 10. Bar 12 then offers a controlled pullback where sellers, despite engulfing the previous body, fail to break the low of Bar 11.
Bar 13 (Current Bar): Demonstrates total demand dominance. Featuring an almost imperceptible lower tail, Bar 13 displays a wide-range expansion where the body occupies nearly the entire candle. Volume backs this move, surging well above its 20-day average.
Key Levels and Trade Scenarios
The impulse on Bar 13 confirms the development of a second leg up following the definitive breakout from the 74-bar wedge.
Bullish Scenario: To sustain the positive bias, price must break and hold closes above the resistance zone at $1.55. Clearing this historical congestion opens a direct path toward local resistance at $2.034, which closely converges with the dynamic resistance of the primary 211-bar bear channel at $2.058.
Bearish Scenario: Should sell-side pressure invalidate the current push, bulls must defend immediate horizontal support at $1.327 (Bar 6 low). Losing this level would once again expose the final buyer stronghold at $1.212.
ATOM‘s technical structure reflects a dynamic shift in market psychology. The descending wedge breakout—driven by the Bar 10 failure pattern and Bar 13’s heavy volume—positions the asset for a crucial litmus test at $1.55 resistance. This zone will determine whether the move evolves into a macro reversal or remains a countertrend bounce.
Disclaimer: This article is strictly informational and does not constitute financial, investment, or trading advice. Cryptocurrency markets exhibit high volatility. Always conduct your own research (DYOR) before making financial decisions.

Communications Professional. Crypto Enthusiast. Economic Journalist. Bitcoiner & Altcoiner.