Against a backdrop of prolonged bearish pressure exceeding 600 bars on the daily timeframe, Polygon (POL) logs a new all-time low by establishing support at $0.0674. From that point, the price has carved out a complex corrective range marked by failed breakouts, bull traps, and an ongoing supply absorption phase at bar 45, challenging the macro downtrend.
Anatomy of a Market Trap: From Support to Resistance Failure
Capitulation and the Initial Bounce
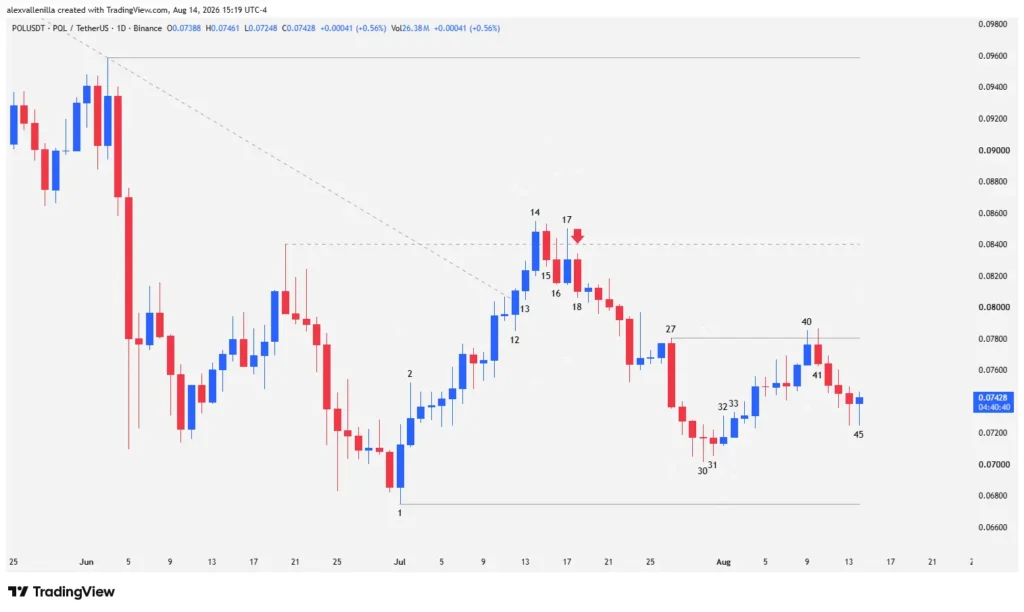
The move kicks off at bar 1, where an outside bar with a bullish close prints a new all-time low at $0.0674, bringing an end to a 62-bar bear microchannel that had been shaping lower highs within a broader macro downtrend lasting over 600 bars. This exhaustion across three pushes fuels a 14-session low-volume bounce, typical of deep-discount phases.
However, structural weakness becomes apparent upon examining bar 12 and bar 13, where a micro trendline breakout lacks conviction. Although bar 14 accelerates slightly in a climactic fashion and punches through the key $0.0840 resistance, bar 15 acts as a classic bull trap. This pullback crushes the illusion of continuation and drags the price back below the key zone, with the failure confirmed by the breakdown of bar 16.
The Second Leg Down and Defense at Bar 30
Following the rejection at bar 17 and a Low2 sell setup at bar 18, the market rolls out a two-legged bearish swing. Bar 27 prints a powerful, high-conviction bear bar that establishes an intermediate resistance at $0.0780.
Even so, selling pressure loses steam. Bar 30 prints a Doji pattern with a pronounced lower wick, respecting levels above the historical support at $0.0674 and forming a higher low that completes the corrective cycle.
Current Scenario: Absorption and Expectation at Bar 45
Following a failed breakout attempt at bar 40 against the $0.0780 resistance and the subsequent pullback validated at bar 42, the price enters a compression zone. Bar 45 (currently developing) displays an internal structure featuring a notable lower wick that, in confluence with the preceding sessions (bars 43 and 44), outlines a clear buying pressure pattern.
Technical data suggests supply is being absorbed. Breaking and closing above the high of bar 45 will validate a new higher low, opening the door for a renewed bullish push toward the $0.0780 resistance. On the macro front, only a sustained break above the $0.0958 resistance will start to invalidate the main bearish structure, while a current rejection could trigger a retest of the critical support at $0.0674.
Polygon’s (POL) price action proves that all-time lows do not equal an immediate definitive bottom. Precise reading of order flow and price action lets you filter out market noise, pinpointing with surgical accuracy where institutional hands and liquidity traps operate.
Disclaimer: This article is for educational and informational purposes only and does not constitute financial or investment advice. Cryptocurrency trading carries a high level of risk; always conduct your own research before committing capital.

Communications Professional. Crypto Enthusiast. Economic Journalist. Bitcoiner & Altcoiner.