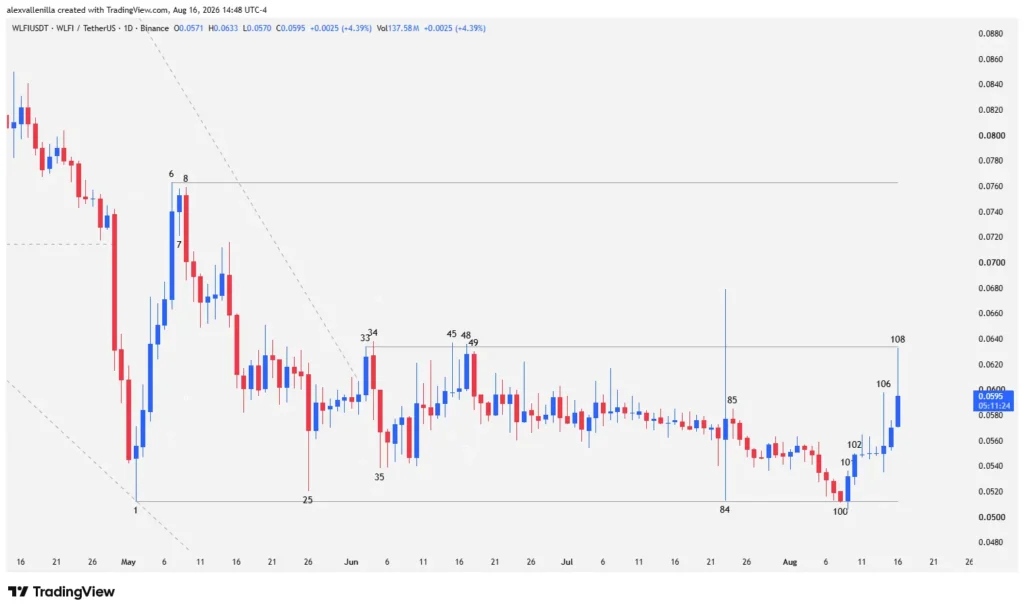
The cryptocurrency market closely watches WLFI’s token behavior on its daily chart (1D), where price action sketches a complex transition following a 139-bar macro downtrend. In recent sessions, the asset fluctuates while respecting critical support at $0.0512 and a structured resistance at $0.0634, generating an accumulation range that defines the current pulse between institutional buyers and dominant sellers.
X-Ray of an Exhausted Downtrend
The digital asset navigates a corrective macroeconomic structure that begins to show clear signs of exhaustion. Price dynamics reflect how institutional order flow interacts millimetrically with historical pivot zones, leaving behind disorderly impulses to make way for a precise reading of volume and candlesticks.
The Climatic Floor and the Birth of the Range
The original corrective movement found structural brakes at Bar 1, which completed a two-legged downside drop from the $0.1007 high, finishing a previous sequence of 139 bearish bars. This hammer-type formation exposed an oversized lower tail and climatic behavior that established a historical minimum support at $0.0512.
The absence of downside continuation validated a descending wedge, allowing Bar 25 to test the capitulation zone once again with high volume. Buyers absorbed available supply, defending $0.0512 and configuring a double bottom that negated immediate selling pressure.
Battle at the Channel Ceiling: The Role of Resistance
With support consolidated, bulls attempted to break the main bearish trendline via Bar 33, which pierced the upper channel boundary by setting a resistance at $0.0634. However, the lack of a high-conviction bar limited the upside reach.
Subsequent attempts, such as Bar 48, suffered a breakout failure by registering volume notably lower than the 20-day average. Bar 49 engulfed that bearish attempt, giving way to a period of lateral congestion characterized by small bodies and multiple overlaps that suggest a technical accumulation phase.
Technical Analysis: The Current Pulse on the Daily Chart
Volatility attempted to revitalize itself in Bar 84, a massive range structure where buyers sought to breach the $0.0634 resistance, but suffered a violent rejection by heavy-handed sellers, who defended the channel ceiling without managing to test the lower support.
Subsequently, the second bearish leg from Bar 85 culminated in Bar 100, slightly piercing the $0.0512 support but halting immediately due to seller weakness. This prompted the bullish response of Bar 101 and Bar 102, generating a price reversal constrained by a lack of temporal efficiency.
At the current moment of the report, Bar 108 attempts to surpass the previous bar’s high to seek a retest at the $0.0634 resistance. Nevertheless, selling pressure injects liquidity at the upper end via a prominent upper tail, reflecting an intense struggle to absorb demand.
WLFI’s price action sits at a critical crossroads within its operating range. As long as the price fails to break decisively above the $0.0634 ceiling and challenge the relevant $0.0763 high, the macro structure remains under the primary bearish influence. Traders must closely monitor the reaction at the extremes to avoid falling into classic market traps associated with the strategy of selling rallies in a downtrend.
Disclaimer: This analysis is strictly educational and informational. It does not constitute financial advice or an investment recommendation. Crypto assets are highly volatile instruments; conduct your own research before executing any position in the market.

Communications Professional. Crypto Enthusiast. Economic Journalist. Bitcoiner & Altcoiner.