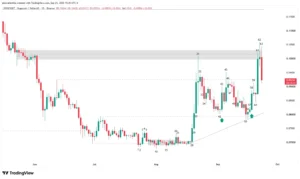
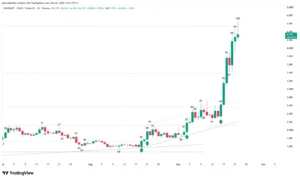
The price of the Hyperliquid (HYPE) cryptocurrency on its daily chart (1D) experiences a technical inflection point after surpassing the resistance of bar 41’s high and breaking the 41-bar bearish trendline. Following a deep correction originating from bar 12’s high and a bear trap at bar 38 ($51.13), buyers take control at bar 53, compromising the previous bearish structure and attempting to resume the primary bullish trend originating at $20.48.
The Bear Trap and the End of the Bear Channel
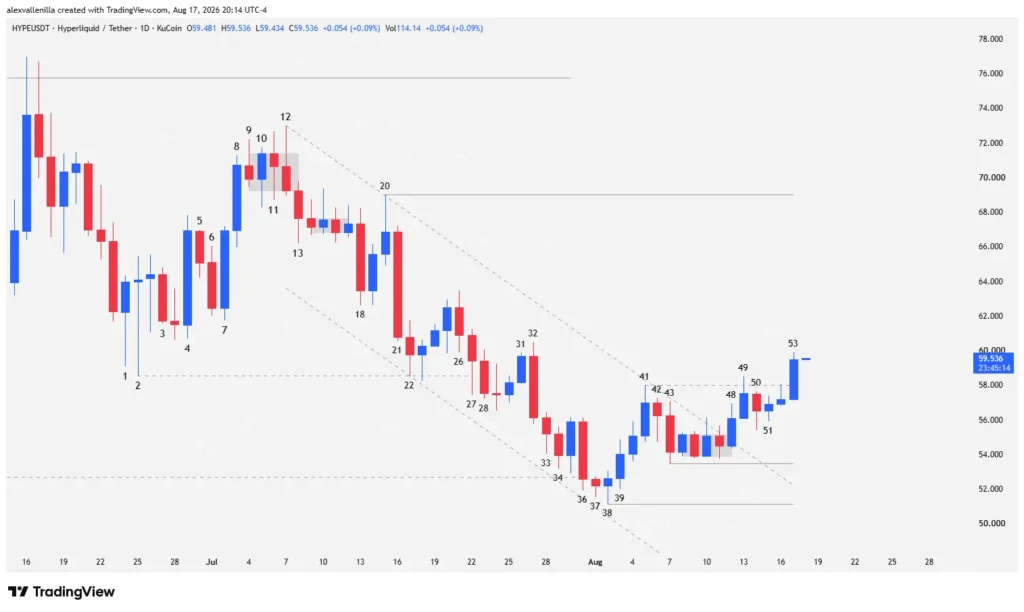
The digital asset market displays constant fluctuations where crowd psychology reflects directly on the chart. The deep correction that HYPE experienced from its bar 12 found a critical halt at bar 36, where bears attempted to pierce the fundamental support at $52.67. However, the subsequent bar 37 halted the momentum and bar 38 acted as a clear bear trap, establishing a new support at $51.135 and allowing the “buy the dip” strategy to flourish within the primary bullish trend.
From this point onward, price development formed a secondary bear channel that was challenged gradually. Bar 48 managed to break the 41-session bearish trendline, although with moderate strength due to its reduced range and the absence of prominent institutional volume.
Consolidation and Resistance Breakthrough
Following the break of the bearish guideline, the price entered a compression phase where bears unsuccessfully attempted to defend the resistance zone located at the high of bar 41 ($58.005). The appearance of a pin bar at bar 50 evidenced solid supply absorption by bulls, invalidating any bearish continuation attempt.
Finally, bar 53 prints a range superior to that observed in previous sessions, closing with more than half of its body above bar 41’s resistance and opening the technical outlook toward higher targets.
Technical Analysis (Top Priority)
The breakdown of price action on the Hyperliquid (HYPE) daily chart (1D) details the following technical narrative:
Bar 36: Bears print a high-conviction bar that traps buyers from bar 35, generating a reversal failure and slightly breaching the first bullish bastion at $52.67.
Bar 37: A bearish-bodied bar with a very small range that halts the drop. By failing to close below bar 36’s low, it cancels bearish continuity and suspends the support breakout.
Bar 38: An outside bar with a bullish body and a prominent lower tail. It traps bears and establishes a new structural support at $51.135, consolidating as a classic bear trap in favor of the primary bullish trend initiated at $20.48.
Bar 41: The fourth leg of the bullish impulse from bar 38. Its high establishes a critical resistance zone at $58.005, becoming the final bearish bastion of the 41-bar channel.
Bars 42 and 43: Bar 42 (an inside, bearish bar) consolidates the price after failing to test the bearish trendline. Bar 43 confirms the minor pullback by closing lower, yet establishes solid local support at $53.467 (a higher low than bar 38).
Bars 46 to 47 (Barbwire Pattern): Price congestion that repeatedly tests the bearish trendline via the highs, without achieving clean closes on the breakout.
Bar 48: Breaks the congestion pattern and the 41-bar bearish trendline to the upside. Nonetheless, it presents weakness by showing a small range, upper tail, and moderate volume.
Bar 49: Gives bullish continuity to bar 48 and temporarily pierces bar 41’s high, although the price fails to close above said resistance.
Bars 50 and 51: Bar 50 acts as a pin bar with a lower tail, reflecting how bulls absorb supply. Bar 51 consolidates the movement with a small doji, producing a bearish pullback failure.
Bar 53: This is the most relevant bar in this segment. Although it does not reach ultra-wide range bar standards, it manages to close with more than half of its body above $58.005 (bar 41’s high). This breakout compromises the deep correction and opens technical doors toward bar 20’s resistance located at $68.99.
Volume and Structure Context
Since bar 38, trading volume remains mostly below the 20-day moving average, with specific exceptions at bars 39 and 41. This volume scarcity, combined with reduced candle bodies, suggests an accumulation phase that validates supports at $53.46 and $51.13.
If bulls confirm bar 53’s breakout with consolidation in subsequent sessions, the price will seek to invalidate the bearish impulse originating at bar 12. Otherwise, a rejection will push the quotation back toward the described local supports.
Price action in Hyperliquid (HYPE) demonstrates that the 41-correction structure has been successfully challenged by buying pressure at bar 53. While reduced volume indicates institutional caution, overcoming previous highs reshapes the technical scenario in favor of bulls, who target the recovery of upper levels of the main trend.
Disclaimer: This article is for educational and informational purposes only and does not constitute financial or investment advice. Cryptocurrency trading carries high risks of loss; conduct your own research before making financial decisions.

Communications Professional. Crypto Enthusiast. Economic Journalist. Bitcoiner & Altcoiner.