Ethereum (ETH) executed a decisive structural shift on the daily chart. After invalidating its long-term downtrend by surging past macro resistance at $2,420, the asset entered a high-absorption consolidation phase (Tight Trading Range). This Bull Flag pattern—forming right above the prior breakout level—suggests that institutions continue to accumulate positions ahead of the next leg up toward the $3,200 zone.
Macro Structure: Shift from Climactic Momentum to Bull Flag
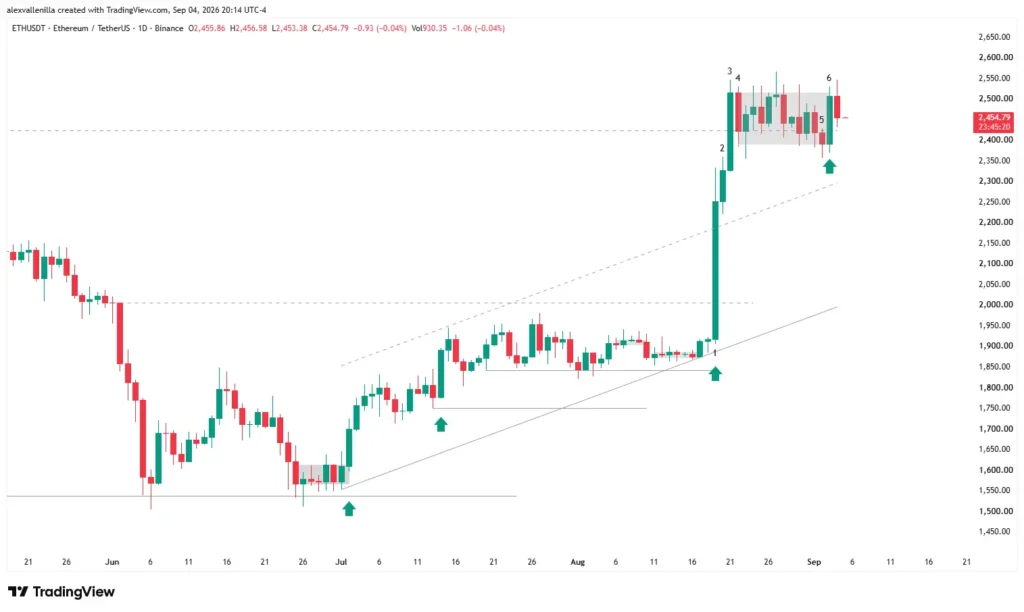
Market behavior reflects a technical polarity shift after registering a Channel Overshoot, characterized by a violent push above the upper boundary of the prior dynamic channel. Strong buying pressure turned the former $2,420 resistance level into a pivotal static support floor.
Instead of generating a deep pullback after price accelerated, price action compressed into a tight range with frequent overlapping bodies and wicks (Barb Wire). This structural setup points to sustained supply absorption by institutional buyers, maintaining latent bullish momentum.
Bar-by-Bar Price Action Technical Analysis
Order flow across the daily candlestick sequence confirms buyer dominance on the chart:
Bar 1 (High-Conviction Bullish / Overshoot): A wide-range Bull Trend Bar closing near its high. It confirms a strong reaction off the dynamic channel’s lower boundary and decisively penetrates intermediate resistance at $2,006. This Bull Surprise shifts overall market dynamics.
Bar 2 (Continuation / Breakaway Gap): Delivers immediate bullish Follow-Through without pulling back, validating the breakaway gap and consolidating price acceptance above $2,006.
Bar 3 (Climax Bar & Main Breakout): Surpasses the key $2,420 level. As a large-range bar following several consecutive bull bars, it acts as both a Breakout Bar and a short-term Buy Climax, justifying the subsequent sideways pause.
Bar 4 (Inside Bar / Incipient Congestion): Serves as a pause bar within the prior range. It initiates the absorption micro-range (Barb Wire), reflecting supply containment at key levels.
Bar 5 (Failed Bearish Breakout Attempt): A narrow-range Bear Signal Bar that attempts to pierce the range support at $2,420. Rejection via the lower wick validates a Failed Bear Breakout.
Bar 6 (Bull Reversal / Bullish Signal Bar): Functions as a bullish Entry Bar within the consolidation. It absorbs previous selling pressure and closes near its high, confirming Bar 5’s bearish failure.
Current Bar (Developing Pullback): Represents a minor pause or Pullback following Bar 6’s push. As long as Bar 6’s low remains intact, the Bull Flag structure stays fully valid.
Technical Signals and Trade Setups
Primary Bullish Setup (Bull Flag Breakout)
Entry Point (Trigger): Buy Stop order 1 tick above Bar 6’s high (around $2,550 – $2,555).
Technical Stop Loss: Placed below Bar 6’s low or Bar 5’s rejection area (around $2,340), protecting the trade beneath the Higher Low structure.
Measured Move Target: Calculating Leg 1’s distance from $1,850 to $2,550 (~$700), projecting from the consolidation base ($2,400) targets the $3,100 – $3,200 range. The next macro resistance sits at $3,400.
Secondary Risk Scenario
A sustained loss of the $2,340 – $2,420 support zone converts the micro-range into a two-leg correction (Complex Pullback), opening the door for a retest of static support at $2,006 before attempting a renewed bullish push.
Market Relevance
Holding price above the former $2,420 resistance proves institutional investors are defending the level as actionable support. Bullish reversal bars at the range extremes confirm market participants view pullbacks as discounted buying opportunities (Buy Below), solidifying the structure for a macro trend resumption.
Disclaimer: This analysis is strictly for informational and educational purposes based on Price Action methodology. It does not constitute investment advice or financial recommendations.

Communications Professional. Crypto Enthusiast. Economic Journalist. Bitcoiner & Altcoiner.