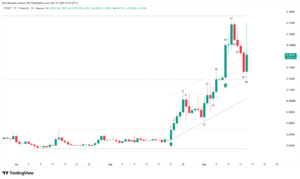
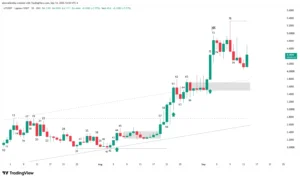
The native token of the Venice protocol (VVV) formally resumed its primary bullish trend after shattering historical resistance at $21.46 during the active session (Bar 79). Featuring a 24% range expansion and trading volume four times higher than its 20-day moving average, price action confirms total supply absorption. This move definitively invalidates the previous lateral accumulation phase and projects a technical target via a measured move toward the $40.04 zone in the medium term.
Market Structure: Primary Trend Resumption
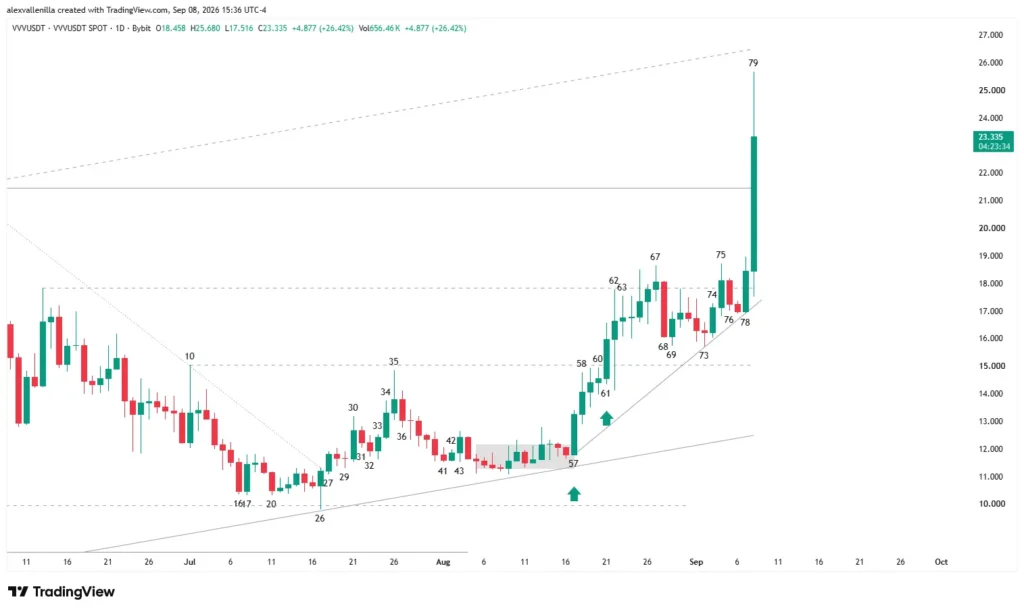
The VVV daily chart reveals the completion of a deep pullback that forced a realignment of the primary bullish trendline built over the last 207 bars. After precisely defending the lower boundary of this macro channel, buyers built a solid sequence of higher lows that culminated in the current breakout.
The market went through a strategic resting phase between Bar 68 and Bar 78, right after the initial leg up that started at Bar 57. This consolidation compressed price against intermediate resistance at $17.85, building up the required energy for the volatility explosion recorded in today’s session.
Order Flow and Candlestick Technical Narrative
Takeoff Phase and Initial Absorption (Bars 57 to 62)
Bar 57: Breaks out of the congestion pattern following the previous failed attempt to clear $15.04. It prints as a high-conviction bullish bar (High 1) with no lower tail, showing immediate buy flow backed by volume well above the 20-day average and a 12.35% gain.
Bar 58: Triggers buy orders immediately above the Bar 57 high, extending momentum without testing resistance at $15.04 (Bar 10 high).
Bar 60: Acts as an inside consolidation bar. It displays a clear deceleration pattern (consecutive shrinking bodies since Bar 57), showing buyer exhaustion right below resistance.
Bar 61: Invalidates the previous deceleration pattern through a high-conviction surge (+9.76%). Its body covers nearly the entire daily range, supported by a heavy volume spike to break $15.04.
Bar 62: Introduces extreme volatility as an outside bullish bar. Sellers attempt to push price down after testing resistance at $17.85 (the high of the previous bearish leg), but buyers absorb the supply, leaving a long lower tail that confirms polarity reversal at $15.04 as new support.
Consolidation and Lows Compression Phase (Bars 63 to 78)
Bars 63 to 67: The market enters a tiny-bodied doji followed by slight pushes. Bar 67 attempts to break $17.85 but shows weakness on low volume.
Bar 68: A bearish pullback bar appears, engulfing Bar 67 with no wicks at its extremes. Although it reflects selling conviction on increased volume, it functions as a pullback within a larger trend that remains prone to failure.
Bar 69: Confirms the failure of downside continuation by printing a bullish body, blocking the sellers’ advance.
Bars 73 to 74: Bar 73 (doji) establishes a crucial higher low that serves as an anchor to draw the secondary 23-bar accelerating bullish trendline. Bar 74 fails to follow through on the drop and prints another higher low.
Bars 75 to 77: Bar 75 attempts to break $17.85 on narrow range and low volume, resulting in a breakout failure evidenced by Bar 76 (bearish inside bar). However, bears fail to test the base of the mini acceleration channel, allowing supply to compress against the $17.85 ceiling.
Bar 78: Buyers regain control and close above $17.85 once again, keeping the secondary trendline intact.
Bar 79: Macro Breakout and All-Time High
Bar 79 (active session) emerges as a wide-range bar that drastically accelerates volatility with a 24% expansion.
Confirms the conversion of the $17.85 area into support via polarity reversal.
Breaks macro structural resistance at $21.46 (the last known high of the primary trend).
Prints a new all-time high at $25.68.
Shows trading volume four times higher than the 20-day moving average, validating the breakout’s authenticity.
Trade Scenarios and Projection
Primary Bullish Scenario: Consolidation or a Bar 79 close above $21.46 confirms the start of the second leg within the macro structure. The measured move projection from the first leg (using the consolidation zone between Bars 68 and 78 as the midpoint) sets a technical target at $40.04.
Bearish / Invalidation Scenario: If buyers lose control and Bar 79 closes below $21.46, the structure will require a pullback toward key support at $17.85. Losing this level opens the door for a deeper test at the lower boundary of the 207-bar primary bullish channel.
Price action in Venice Token (VVV) provides a masterclass in order flow: persistent higher lows ultimately drained supply at $21.46. Should this breakout hold through the daily close, VVV enters price discovery mode with its eyes set on the $40 threshold.
Disclaimer: This article is strictly for educational and informational purposes based on price action technical analysis. It does not constitute investment advice, financial advice, or an offer to buy or sell digital assets. Cryptocurrencies are high-volatility assets; always do your own research (DYOR) before making financial decisions.

Communications Professional. Crypto Enthusiast. Economic Journalist. Bitcoiner & Altcoiner.