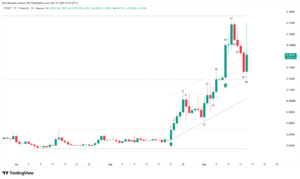
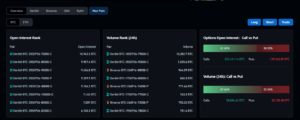
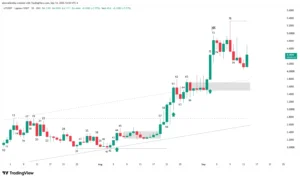
The Near Protocol (NEAR) market completed a decisive structural transition on its daily chart. After undergoing a deep correction starting from the highs of Bar 1, NEAR’s price compressed volatility within a 64-bar falling wedge. The inability of selling pressure to decisively break below the key support zone at $1.469 paved the way for aggressive institutional buying, validated by an exponential surge in trading volume.
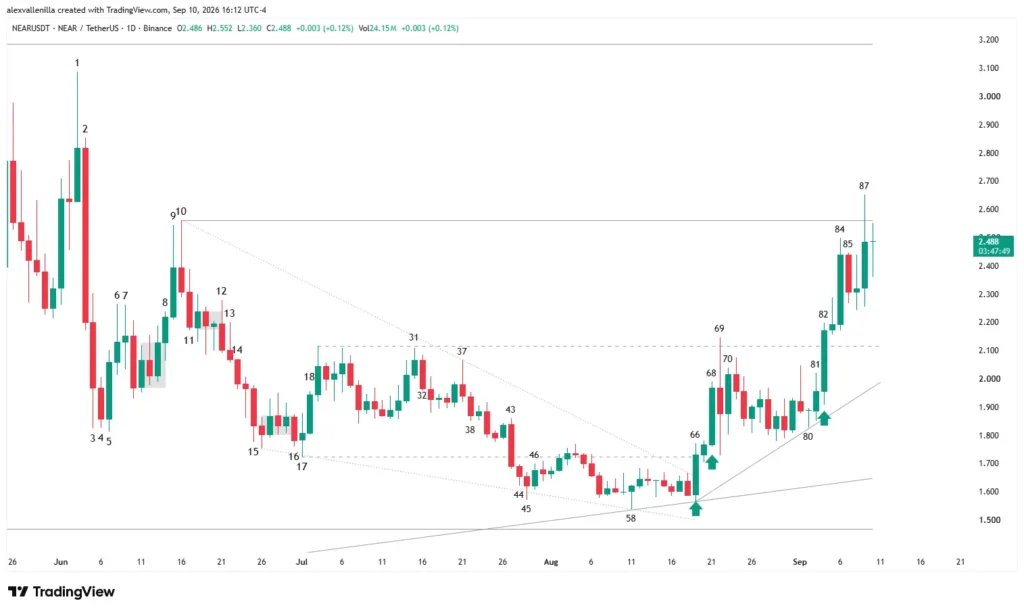
Currently, the NEAR token trades around $2.562, after confirming a resistance-to-support flip at $2.116 and resuming a higher-timeframe bullish market structure targeting $3.185.
Price Action Technical Analysis
Bar-by-bar price action reveals the shift in order book dominance:
Bar 31 & 32: Bar 31 forms a double top after unsuccessfully testing resistance at $2.116 (the high of Bar 19). Bar 32 validates this bearish signal by closing below the low of Bar 31.
Bar 37 & 38: The high of Bar 37 sets the anchor point for a 64-bar descending trendline. It prints an inverted hammer with an extended upper shadow, immediately confirmed by Bar 38, which closes below its low.
Bar 43 & 44: Bar 43 emerges as a high-conviction bear trend bar (institutional strength) breaking support at $1.723 (the low of Bar 17). Bar 44 holds the breakout, albeit with a tight range.
Bar 45 & 46: At Bar 45, a pin bar with a long lower tail tests the bottom of the falling wedge. The push lower is rejected at the close. Bar 46 attempts a reversal by surpassing the previous high, but the bounce stalls upon retesting $1.723, which acts as temporary resistance.
Bar 58: A decisive inflection point. It prints a hammer with a deep lower tail that successfully defends $1.469. This serves as the anchor point to project a 216-bar ascending trendline, putting an end to the deep correction.
Bar 66 to 68 (First Bull Leg): Bar 66 convincingly breaks out of the falling wedge on heavy volume, closing above $1.723 and triggering a High 1 buy signal. Following a pause at Bar 67, Bar 68 delivers continuation to the momentum with another high-conviction bar (High 1 reconfirmed).
Bar 69 & 70: Tactical battle at $2.116. Bar 69 forms an outside bar displaying extreme volatility, with trading volume quadrupling the 20-day average. Bar 70 contracts the range as an inside bar consolidation.
Bar 81 to 84 (Second Bull Leg): Bar 81 creates a High 1 setup by closing above Bar 80. Immediately following, Bar 82 acts as the breakout bar (High 2), directly clearing resistance at $2.116. Bar 84 retests this level, confirming the flip from resistance to support.
Bar 85 & 87: Bar 85 presents a failed internal pullback. Bar 87 attacks critical resistance at $2.562 (the high of Bar 10); despite experiencing profit-taking indicated by an upper wick, it successfully absorbs remaining sell-side liquidity.
Trading Scenarios and Market Outlook
Bullish Scenario (Trend Validation)
If buying pressure secures a daily close above resistance at $2.562, order flow will unlock toward the main target at $3.185 (the high of Bar 1). A breakout above $3.185 would confirm the onset of a medium-to-long-term bullish market structure.
Bearish Scenario (Technical Pullback)
Having completed two distinct bull legs since Bar 66, the market could enter a pause or consolidation phase. The key level to monitor in the event of a pullback is primary dynamic support at $2.116. As long as buyers defend this level, the higher-low structure remains intact.
Final Outlook
The validated breakout from the falling wedge and the resistance-to-support flip at $2.116 confirm a clear shift in dominant market psychology for NEAR Protocol. Supply absorption at key levels suggests that bulls remain in structural control against potential short-term pullbacks.
Disclaimer: This analysis is strictly for informational and educational purposes. The content provided does not constitute investment advice, financial recommendations, or trading guidance. Cryptocurrency markets exhibit high volatility; always execute your own risk management strategy before making trading decisions.

Communications Professional. Crypto Enthusiast. Economic Journalist. Bitcoiner & Altcoiner.