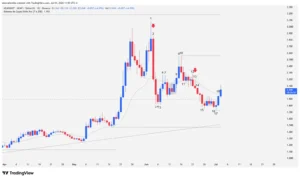
The NEAR Protocol (NEAR) market is going through a macroeconomic inflection point on its daily (1D) chart. After a prolonged 109-bar bearish cycle, buyers structured a solid medium-term recovery over 147 sessions, featuring consecutive higher lows. However, violent demand absorption near the psychological resistance at $3.18 injected extreme volatility, forcing a deep correction that currently challenges price control directly on the 20-period exponential moving average (20 EMA).

Chart Anatomy: Price Bares Market Psychology
Price action does not lie. Behind every candlestick hides the footprint of institutional orders, forced liquidations, and the transfer of risk between weak hands and professional traders. NEAR’s recent behavior on the daily timeframe offers a masterclass in market auctions, bear traps, and deceleration patterns.
The Rejection at the Highs and the Institutional Selloff
The current narrative originates in Bar 1. Bulls execute an aggressive raid to test technical resistance at $3.18, which represents the peak of the previous bearish impulse. However, order flow dynamics reveal severe absorption: bears flood the market with sell liquidity, rejecting the price before it hits the target. This leaves an efficiency gap (gap) and a prominent upper wick that doubles the size of the candle’s real body, confirming massive profit-taking at the highs.
The supply response is immediate and punitive. Bar 2 prints as a wide-range candle with absolute bearish conviction. The violence of this move drives the price below local support at $2.21 and pierces the 20 EMA, simultaneously breaking the lows of the previous four sessions. This action cancels immediate bullish momentum and triggers technical sell signals (sell triggers) that force retail capitulation.
The Battle at the $1.89 Support and the Deceleration
Price seeks high institutional liquidity zones to stall the selloff. In Bar 3, the market increases volatility, printing wicks on both ends. Buyers step in with size at the lows, defending support at $1.89 (the former key resistance of the major bearish cycle). The relevance of this level is absolute: it is the foundation upon which NEAR built its new medium-term bullish structure.
Bar 4 (Inside Bar): Functions as a bearish inside bar. Although it momentarily pierces $1.89, it fails to break the previous session’s low or close below it. The systematic shrinking of the real bodies between bars 2, 3, and 4 typifies a technical supply deceleration pattern.
Bar 5 (Outside Bar): A bullish outside bar that engulfs the previous price action. The market executes an immediate reversal by capturing the liquidity of lagging sellers.
Liquidity Traps and Microchannel Structure
Following the reversal on Bar 5, bulls attempt to regain control in two well-defined upward legs, but the 20 EMA acts as a formidable dynamic barrier.
The 20 EMA Block and the Two-Legged Cycle
Bar 6 pierces the 20 EMA, but selling pressure compresses its body, leaving another upper wick. Immediately after, Bar 7 consolidates as a bullish Doji inside bar. The visual sequence of bars 5, 6, and 7 shows an extreme loss of momentum against the moving average, triggering a three-day congestion.
Although Bar 8 manages to break out of this micro-range to the upside, Bar 9 fails to confirm continuation. Bears press again at the highs, mathematically completing a two-legged measured move cycle from the Bar 4 low. With demand running out of gas, Bar 10 establishes a new local resistance at $2.56, showing zero follow-through and opening the door to a new retracement.
The Range Breakout and Trapping Shorts (Bear Trap)
Retracement confirmation arrives with Bar 11, which breaks the low of Bar 10 and drags the price into a horizontal entanglement with the 20 EMA. The resolution of this conflict seems to lean in favor of the bears on Bar 12, a bearish outside bar that breaks the micro-range to the downside, printing a lower high suited for bearish continuation.
Low 2 Setup (Bar 13): This candle triggers a technical short setup (Low 2 short setup) inside a bearish microchannel. However, context analysis warns of danger for the bears: price trades against the macro trend (higher lows over 147 bars) and dangerously close to the $1.89 support.
Activation and Failure (Bars 14, 15, and 16): Bar 14 triggers shorts by breaking the previous low; Bar 15 pushes the price below dynamic support down to $1.83. However, the range of subsequent candles narrows drastically, trapping the market in a 5-bar sideways consolidation with no bearish follow-through. Bar 16 attempts to break the base of the congestion, but its close remains extremely weak.
The Outside Reversal (Bar 17): This session is a game-changer. It acts as a powerful outside bar that completely absorbs the supply from Bar 16. By denying bearish continuity, it traps shorts (shorts trapped) who entered on the false breakout. Its low establishes a definitive support at $1.72, successfully defending the macro zone at $1.46.
Macro Perspective: Where Is NEAR Heading?
Bar 18 confirmed the breakout failure by printing a green conviction candle, validating support at $1.72, although its modest average range notes institutional caution.
In the current session, the developing candle executes a clean upside breakout of the 20 EMA, validating the buying pressure of the previous session. The technical structure is definitive: price has been compressing its movements, logging a lower high at $2.56 but keeping the medium-term higher-low trendline completely intact.
Critical Scenarios for Order Flow
Bullish Scenario (Institutional Validation): If buyers manage to sustain a daily close above the 20 EMA, the compression structure will resolve to the upside. Order flow will immediately target the buy liquidity located at the Bar 10 resistance, set at $2.56. Consolidation above this level would clear the path to retest the macro zone at $3.18.
Bearish Scenario (Impulse Invalidation): If the current session suffers a late rejection and closes below the 20 EMA, bears will pressure the structure once again. The first mandatory technical support target lies at the Bar 17 low, at $1.72. Losing this level would neutralize the 147-bar bullish trend, forcing a search for deep structural liquidity near $1.46.
NEAR Protocol remains in a critical accumulation phase where price action cleanses market excesses. The failure of bears to sustain price below $1.89, combined with the Bar 17 bear trap, hands the tactical advantage to buyers. The resolution at the 20 EMA will dictate whether we face the genesis of a new institutional impulse toward highs or a prolonged distribution.
Disclaimer: The information presented in this analysis is for educational and informational purposes only and should not be considered under any circumstances as financial investment advice. Trading cryptocurrencies and digital assets carries a substantial risk of capital loss.
Communications Professional. Crypto Enthusiast. Economic Journalist. Bitcoiner & Altcoiner.