Solana (SOL) price consolidates a structural trend reversal on its daily chart after successfully breaking above the key resistance at $97.68—now converted into dynamic support. During recent sessions, spanning from bar 58 to bar 82, the market developed a complex bull flag pattern, characterized by multiple reversal failures and a bear trap at bar 76 that liquidated short positions. Backed by an explosive high-conviction institutional bar at bar 79 and a notable increase in trading volume, price seeks to challenge resistance at $121.66, with technical projections pointing toward $137 and $149 in the medium term.
Market Structure and Context
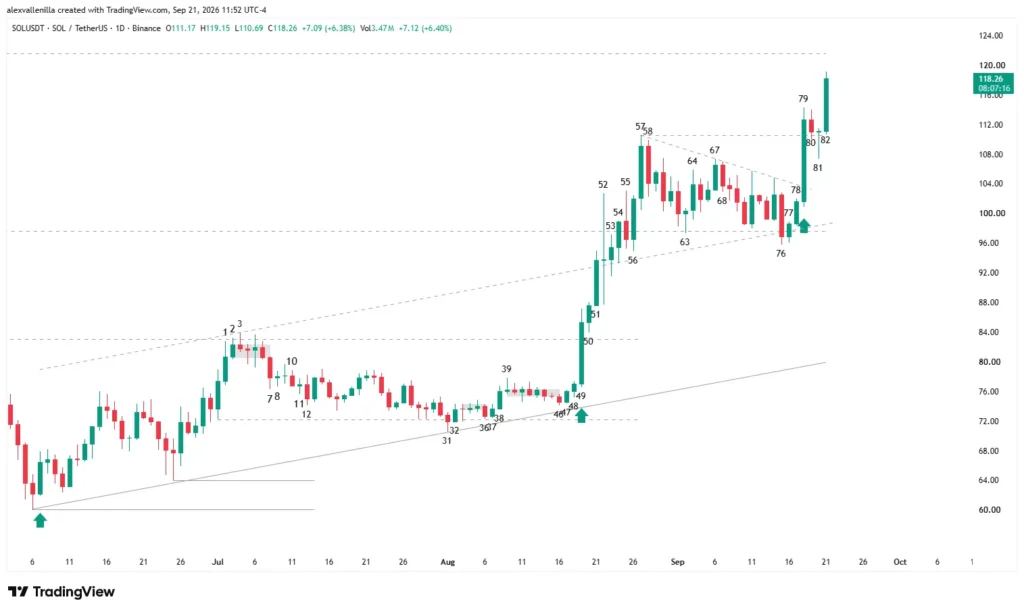
The Solana market validates a solid structural transition after breaking above the $97.68 zone, a level that historically accumulated previous bull traps. Buyers successfully defend this area, allowing price to build an accelerated bull channel within a cycle of the last 107 bars. Following an initial momentum generated from bar 49, price experienced a resting zone in the form of a flag, absorbing floating supply before reactivating the flow of buying orders.
Technical Analysis: Price Action and Order Flow
Price action exhibits a precise technical narrative through the sequence of recent candles, where strong hands dictate the directional bias of the market without relying on lagging indicators:
Initial Consolidation Phase (Bars 58-68): Bar 58 prints a bearish body inside bar that consolidates price following the breakout of $97.68. It follows a succession of reversal failures and pullbacks in a 0i0i0i pattern that shapes a bull flag. Bar 63, a hammer pattern, tests support at $97.68 without achieving a lower close, while bar 64 breaks the failure sequence to seek new momentum. Later, bar 67 establishes an anchor high to draw a descending trendline (forming a pennant below the high of bar 57), and bar 68 prints a new bearish inside bar that evidences the initial difficulties of buyers to maintain immediate continuity.
The Bear Trap and Institutional Trigger (Bars 76-79): Bar 76 emerges as a high-conviction bearish candle that momentarily pierces the $97.68 support and the upper side of the bull channel. However, this breakdown lacks trading volume compared to the previous bullish momentum. Immediately, bar 77 (bullish inside bar) and bar 78 (which confirms the failure of the bearish breakout of bar 76) push price back above the support zone. This context triggers bar 79, a powerful wide-range, high-conviction bar driven by strong hands. Bar 79 breaks the microchannel’s descending trendline from bar 57, traps the sellers from bar 76 forcing them to liquidate short positions, and closes above the high of bar 57.
Current Evolution and Continuation (Bars 80-82): Following the impulse, bar 80 and bar 81 (a doji with a wide lower tail that absorbs supply) consolidate price without closing below the new support located at $110.60. Currently, bar 82 prints a high-conviction bullish candle that exceeds the high of bar 79, projecting directly toward key resistance at $121.66 with the firm backing of trading volume.
Action Scenarios and Price Projections
Buyers dominate current price action through the strategy of buying pullbacks, evidenced in the reaction of bars 77 to 79.
Main Bullish Scenario: If price breaks and consolidates above resistance at $121.66, the measured move projected from the leg spanning between bar 47 and bar 57 enables a technical target at $137, with a subsequent viable extension toward the $149 zone. This would complete a two-legged structured bull cycle.
Caution Scenario: In the event that the $122 resistance temporarily rejects the advance, buyers must successfully defend immediate support located at $110.60 to keep the bullish continuation structure intact.
Solana price action demonstrates how the invalidation of bearish breakouts and the institutional absorption of supply build solid bases for sustainable trends. The asset’s ability to surpass critical resistance levels without losing volume backing positions SOL at a decisive technical juncture for upcoming sessions.
Disclaimer: This technical analysis is for educational and informational purposes exclusively and does not constitute financial or investment advice. Cryptocurrency trading carries a high level of risk; perform your own research before executing any trade in the markets.

Communications Professional. Crypto Enthusiast. Economic Journalist. Bitcoiner & Altcoiner.