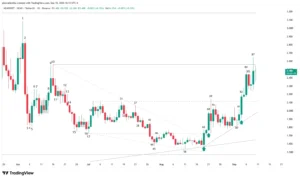
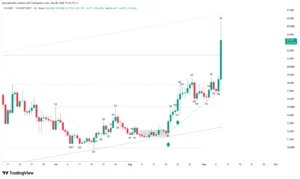
Near Protocol’s native token (NEAR) is staging one of the most aggressive crypto market rallies of the year. After completing an extended accumulation phase, price action logged a parabolic impulse from the $2.56 region to hit an intraday high right against the key $4.53 resistance level. This movement, driven by institutional capital and “smart money,” confirms a structural medium- and long-term trend shift. However, the emergence of technical exhaustion patterns in recent sessions suggests that volatility may demand a healthy pause before pushing for new highs.
Market Structure: Historical Breakout and Polarity Flip
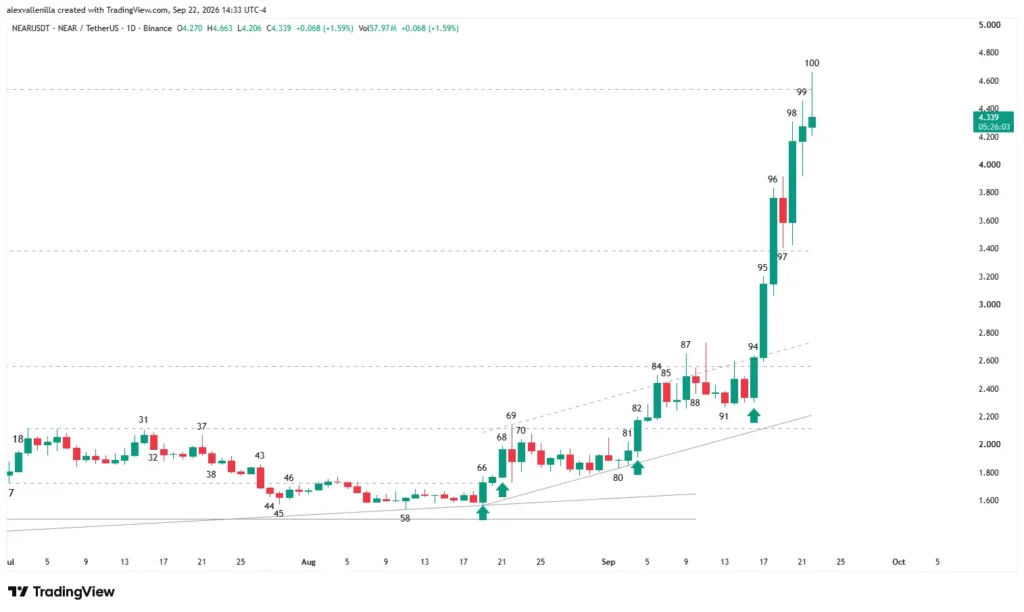
NEAR’s recent dynamics have radically transformed its daily chart architecture. For over 500 bars, price remained trapped in a bearish, sideways consolidation structure, repeatedly rejecting the $3.38 resistance level.
Recent buying order flow violently broke this bias, generating a series of high-conviction bars that invalidated previous selling pressure. Supply absorption at the key $2.56 and $3.38 levels confirmed a technical polarity flip: these former impenetrable ceilings now act as structural support zones for buyers.
Price Action Technical Analysis (Bar-by-Bar)
The bar-by-bar breakdown on the daily timeframe (1D) reveals market psychology, liquidity pool interactions, and volume evolution:
Bar 88: Acts as an inside bar for consolidation and pullback at the top of a micro bull channel. Supply temporarily defends the $2.56 resistance (Bar 10 high), causing a pause in the move.
Bar 91: Displays a very narrow-range bearish body. The low fails to test the lower support at $2.11. The pullback from Bar 88 shows overlap, narrow-range candles, and an absence of volume, highlighting a lack of conviction and seller weakness.
Bar 94: Prints a high-conviction candle with a minimal upper wick (cap). Smart money enters the market, driving price above $2.56 with a significant volume surge. The bar touches the top of the bull channel and issues the first clear buy signal, triggering confirmation upon breaking its own high.
Bar 95: Strong confirmation. Bulls print a wide-range candle that doubles previous volume, delivering a 20.07% push. The bar closes completely outside the top of the bull channel, logging an overshooting move that signals trend acceleration. Bar 95’s low holds above the now-support level at $2.56, absorbing sell orders and liquidating short positions.
Bar 96: Climactic acceleration bar. It expands beyond Bar 95 in size accompanied by a substantial volume spike. It successfully pierces the $3.38 resistance (a level that acted as a bull trap at the Bar 1 high and had gone unbroken for 500 bars). It closes over half its body above $3.38, invalidating the multi-month bearish structure. However, given its climactic magnitude, it warns of potential profit-taking needs.
Bar 97: Following three acceleration legs, this pullback bar appears. However, supply lacks the strength to test the new support at $3.38. It features a pronounced lower wick relative to its body, demonstrating immediate buyer intervention defending the level.
Bar 98: High-conviction bullish candle with heavy volume that breaks above Bar 97’s high, executing a fading pattern failure. It closes above the previous high, ratifying support strength at $3.38 and providing continuity to the parabolic trend.
Bar 99: Prints a Doji candle, reflecting indecision at the top of the move. Although it retains an upper wick signaling persistent buying pressure, the inability to test the $4.53 resistance reveals early signs of buyer exhaustion.
Bar 100 (Developing Bar): Forms an Inverted Hammer pattern. Bulls attempted to penetrate the $4.53 resistance, but supply rejected the advance, keeping price action below that level. The temporary closing price sits below Bar 99’s high, confirming a short-term loss of bullish momentum.
Operationally Relevant Scenarios
Bullish Continuation Scenario: If buyers absorb supply in the current zone, break the $4.53 resistance, and consolidate price above it, it opens a technical projection toward the next target level at $6.23.
Corrective Scenario (Profit-Taking): Given the presence of climactic candles (Bars 96 and 98) and the momentum loss in Bars 99 and 100, price may enter a re-accumulation technical pullback. In this case, the $3.38 level acts as the primary critical support zone to assess whether demand maintains control over the new bullish structure.
Significance of the Move
The breakout logged by Near Protocol marks a technical milestone by clearing a 500-day sideways range structure. These types of volume-backed institutional expansions do not merely validate a market cycle shift for the asset—they redefine liquidity levels for price action traders, positioning NEAR as one of the strongest relative strength assets across the Layer 1 ecosystem.
Disclaimer: This analysis is purely for informational and educational purposes based on price action technical studies. It does not constitute investment advice or financial counsel. Cryptocurrency markets carry high volatility; conduct your own research before making trading decisions.

Communications Professional. Crypto Enthusiast. Economic Journalist. Bitcoiner & Altcoiner.