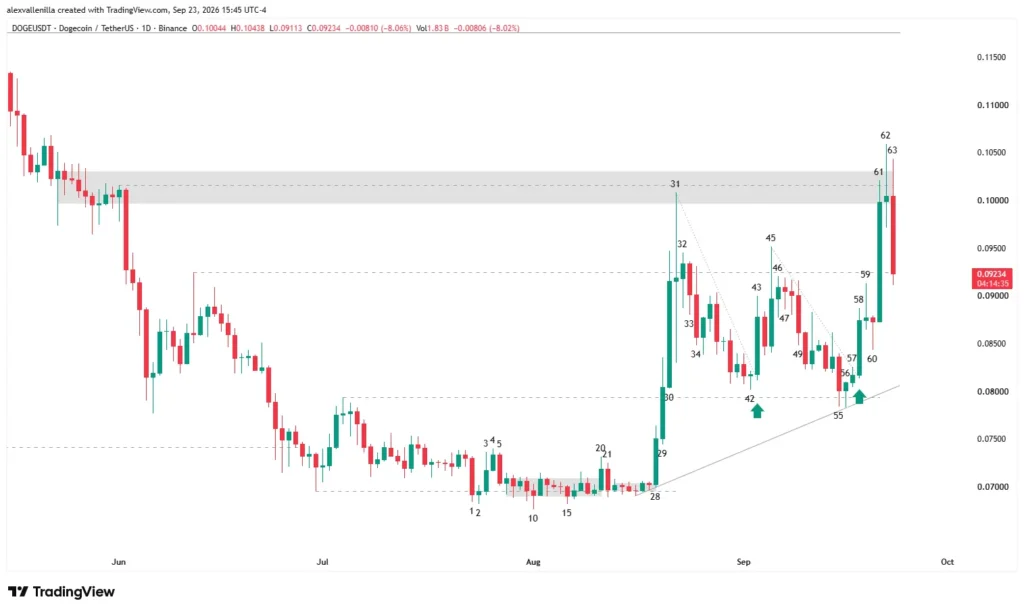
Smart money in the market just validated a major reversal structure on the Dogecoin (DOGE) daily chart. Following two failed attempts by sellers to break through key support at $0.0793, buyers took control of the order flow with high-conviction bars and volume above the 20-day average. The breakout above resistance at $0.0924 confirms the formation of a double bottom and the creation of a long-term higher low. However, the recent rejection at the $0.1015 liquidity magnet forces traders to closely monitor the test of the newly established support in the short term.
Buyers Awaken Beyond the $0.0793 Barrier
Over recent weeks, Dogecoin’s price action reflected an intense battle between supply and demand. The bears’ inability to consolidate selling pressure below the critical $0.0793 zone triggered a radical shift in market psychology. In professional trading, when price fails twice consecutively to hit a breakout target, dynamics typically reverse violently in the opposite direction.
This behavior led to an aggressive surge that broke previous deceleration trendlines. Institutional capital inflows propelled the asset toward immediate resistance at $0.0924, a level that previously acted as an overhead ceiling during prior consolidation phases.
The Battle at the $0.1015 Magnet Zone
The expansion move drove DOGE to test the projected congestion area at $0.1015. This level acted as a liquidity magnet and caused a natural pause in the trend. At these levels, market participants who accumulated at lower prices took profits, temporarily halting buying momentum and sparking a technical pullback toward the freshly captured support level.
Technical Analysis: Bar-by-Bar Price Action Narrative
Consolidation Phase and Initial Bearish Control (Bars 32 to 34)
Bar 32: Prints as a consolidating inside bar. Volatility contracts sharply relative to the previous session, managing to hold slightly above resistance at $0.0924.
Bar 33: Sellers initiate a technical pullback and secure an operational close below the $0.0924 mark.
Bar 34: Breaks the low of Bar 33, confirming bearish initiative. From this point, the asset begins a correction under a downward trendline drawn from Bar 31. After a failed two-bar reversal attempt, the market completes a two-leg downside move.
Deceleration and Trendline Breakout (Bars 42 to 49)
Bar 42: Forms a very narrow-range hammer following two low-volatility sessions. Its low fails to test support at $0.0793, leaving a price gap. This technical failure demonstrates a lack of follow-through and overt weakness from the selling side.
Bar 43: Bulls print a high-conviction bar with a 7.41% range. It breaks the previous minor downward trendline on trading volume exceeding the 20-day moving average. This action confirms that the low of Bar 42 sets a higher low relative to the Bar 10 low.
Bar 45: Buyers attempt to clear resistance at $0.0924. However, the bar shows an extended upper wick relative to its body, indicating overhead supply. Although it breaks above the level intraday, price closes below resistance.
Bars 46 and 47: Display inside bars with closes confirming buyers’ temporary inability to absorb supply at $0.0924.
Bar 49: Breaks the low of Bar 48 and validates the rejection at the resistance zone, giving way to a four-session consolidation.
The Double Bottom and Smart Money Expansion (Bars 55 to 61)
Bar 55: Bears attempt a downside breakout from consolidation. They poke slightly below support at $0.0793 but lack the momentum required to close below the level.
Bar 56: A small-range hammer bar appears, abruptly halting the selloff from Bar 55. The low of this bar serves as the anchor point for a new 39-session bullish structure.
Bar 57: Confirms the reversal intent set by Bar 56 while maintaining a tight range.
Bar 58: Smart money enters the market, printing a solid conviction bar with virtually no lower shadow. It breaks the recent downward trendline and confirms a double bottom between Bars 42 and 56 at $0.0793 support. The second failed supply attempt at $0.0793 triggers a clear buy entry signal.
Bar 59: Attempts to follow through on Bar 58’s momentum. It fails to test resistance at $0.0924, showing partial profit-taking at higher levels.
Bar 60: Prints a bearish-bodied hammer with a pronounced lower shadow, pointing to a minor pullback.
Bar 61: Delivers a strong bullish impulse bar that breaks through $0.0924 resistance. Trading volume more than doubles the 20-day average, validating the breakout’s strength. However, the advance stalls precisely at $0.1015 resistance—a prior congestion zone that acted as a liquidity magnet and prevented a close above that level.
Loss of Momentum and Current Reassessment (Bars 62 and 63)
Bar 62: Forms as an inverted hammer at the top of the move. The long upper wick reflects profit-taking, and the inability to close above Bar 61 signals a clear loss of buying momentum.
Bar 63 (In Progress): Shows a strong high-conviction bearish bar breaking the low of Bar 62. Price is testing demand at the new support level of $0.0924.
Market Structure and Wrap-Up
Dogecoin maintains a higher-low structure on short- and medium-term timeframes over the last 39 bars. Respecting support at $0.0793 and the subsequent double bottom confirmation established the foundation for a structural polarity shift.
However, the technical backdrop calls for caution: the current rejection at $0.1015 creates potential for a double top with the Bar 31 high. If demand fails to hold support at $0.0924 and ultimately loses the crucial $0.0793 level, the new bullish structure will be completely invalidated.
Key Trading Scenarios to Watch
Bullish Scenario: Requires buyers to hold price above support at $0.0924 during the ongoing pullback. A renewed push clearing resistance at $0.1015 would open the door toward the next technical target at $0.1175.
Bearish Scenario: A loss of intermediate support at $0.0924 would increase selling pressure toward the defensive zone at $0.0793. A breakdown below this level would invalidate the recovery thesis and resume the broader long-term bearish bias.
Disclaimer: The information provided in this article is presented exclusively for educational and informational purposes regarding price action and does not, under any circumstances, constitute investment advice, financial counsel, or a solicitation to buy or sell digital assets. The cryptocurrency market carries high volatility and substantial risk. Every investor must conduct their own research (DYOR) and evaluate their risk tolerance before making financial decisions.

Communications Professional. Crypto Enthusiast. Economic Journalist. Bitcoiner & Altcoiner.