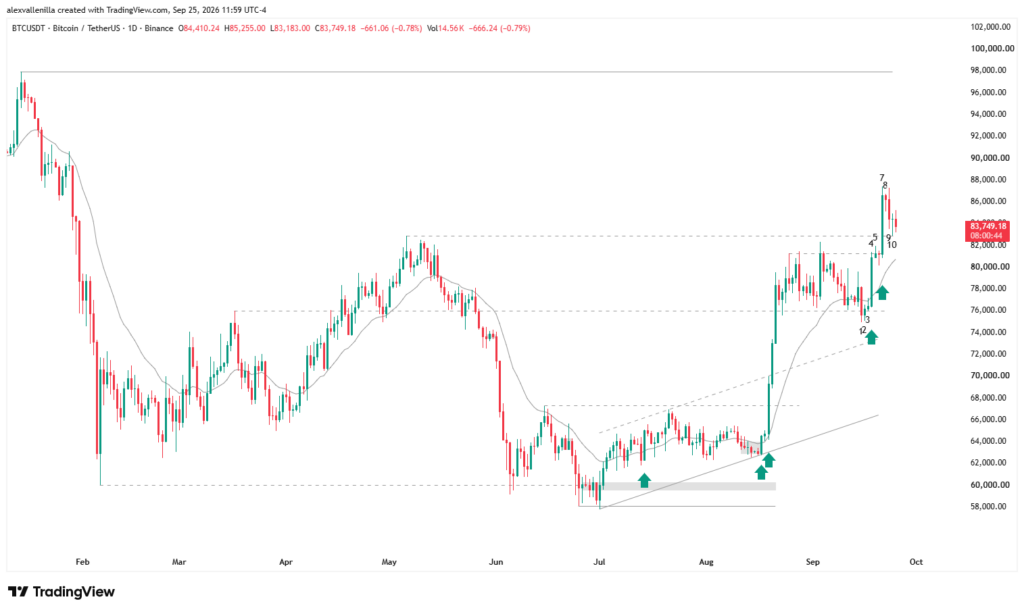
Bitcoin’s (BTC) technical structure on the daily timeframe executed a decisive invalidation of selling pressure after consolidating a second consecutive breakout failure at primary support and triggering an institutional buying squeeze. After bears failed for a second time to extend the correction below the $76,000 level, deep pockets aggressively entered the market, absorbing floating supply at $81,300 resistance and printing high-conviction bars that catapulted price action above the key pivot at $82,850. This price action not only confirms the breakout of a previous 142-bar bearish structure, but also projects a direct measured move toward the $98,000 zone.
Daily Chart Anatomy: The Collapse of Bearish Momentum
The recent narrative on the Bitcoin daily chart shows market psychology shifting from fear of a severe correction to absolute buyer dominance in order flow. After getting trapped in a bull flag consolidation bounded by dynamic support at $76,000 and upper resistance at $81,300, the asset went through an execution sequence where bulls relentlessly capitalized on the lack of selling follow-through.
Price Action Technical Analysis (Bar-by-Bar)
Bar 1: The High-Conviction Bear Trap
Bar 1 prints as a wide-range, high-conviction bear trend bar accompanied by a slight uptick in volume. This bar temporarily pierces $76,000 support, representing sellers’ initiative to force a deep correction and break the base of the bull flag. By crossing below the 20-period exponential moving average (20 EMA) for a second time, Bar 1 completes a Moving Average Double Top (M2S) setup, issuing a highly significant technical sell signal.
Bar 2: The Breakout Failure and Internal Reversal
Bar 2 immediately neutralizes the bearish threat by forming an internal bull bar. Buying flow absorbs supply at the lows and pushes the daily close back above $76,000 support. This event creates a support breakout failure and directly invalidates the M2S signal. Pure Price Action theory dictates that when sellers fail twice in a row to achieve their structural objective (Two-Attempt Failure Rule), the market tends to react with a powerful move in the opposite direction.
Bar 3: Absorption and Lack of Selling Follow-Through
Bar 3 trades inside a tight range above $76,000. Although the bar lacks the strength to cross the 20 EMA or break the high of Bar 2, it confirms sellers’ technical inability to print wide-body follow-through bars. The absence of selling pressure exposes the exhaustion of available supply in this area.
Bar 4: The Trigger Bar and High 2 Setup
Institutional money takes complete control of order flow. Bar 4 develops as an extreme conviction bull bar, shaved clean at its low (Marubozu on Low), which confirms that limit and market buy orders pressed from the open. Printing nearly a 6% gain accompanied by a noticeable volume spike, the bar leaves no significant upper tail and pushes price well back above the 20 EMA. This bar breaks the prior bear microchannel and establishes a high-probability High 2 signal, triggering buy stop orders sitting above its high.
Bar 5: Flag Opening and Resistance Test
Bar 5 extends the momentum and breaks above the high of Bar 4, activating stop-market orders from trend-continuation traders. Bulls attempt to pierce the upper boundary of the bull flag at $81,300. Although the bar’s range contracts and the close lands right on resistance, price action confirms the return and hold above the 20 EMA.
Bar 7: Supply Absorption at $81,300 and Key Pivot Breakout
Following a minor pullback in Bar 6, Bar 7 unleashes an explosive breakout. This wide-range bull bar—substantially stronger than Bar 4—traps countertrend sellers looking to reject the $81,300 level. Price closes cleanly above that level, driven by nearly a 7% gain and trading volume that doubles the 20-day volume moving average. Bar 7 also breaches key resistance at $82,850—a pivot that served as a bull trap in the prior 142-bar structure—definitively invalidating the previous bearish geometry and initiating a new structure of higher lows and higher highs.
Bar 8: Consolidation and Profit-Taking
Bar 8 presents as an internal bear body bar. It represents a healthy pause where remaining supply takes light profits. Crucially, price holds and consolidates above $82,850, validating this former ceiling as new floor through the principle of Resistance-to-Support Flip.
Bar 9: Contained Volatility Expansion
Bar 9 prints as an outside bear body bar that brings a marginal increase in intra-session volatility. However, price action fails to disrupt the newly established support structure.
Bar 10: Support Rejection via Dragonfly Bar
Bears attempt to test the $82,850 area, but Bar 10 responds with a strong buying rejection. It forms as a dragonfly bar with virtually no body and a prominent lower tail, demonstrating aggressive bid inflow the moment price touches support.
Bar 11: Developing Session and Bearish Deceleration
In the current session (Bar 11), the bar trades with a temporary bearish bias. However, the session low leaves $82,850 support completely intact. This pullback, which shows clear structural deceleration since Bar 8, features narrow-range bars and a lack of selling volume, ruling out any threat of a deep correction for now.
Trade Scenarios and Projected Analysis
The dominant market structure indicates bitcoin is building a two-legged upward impulse (Measured Move) following the breakout above the $82,850 barrier. As long as price action maintains daily closes above this pivot, the market holds a high probability of driving toward the next zone of technical liquidity.
Base Case (Bullish): If demand defends the polarity shift zone at $82,850, the projection based on an equivalent extension of the first impulse leg places the market target at the technical and psychological level of $98,000.
Alternative Case (Bearish): Should Bar 11 or subsequent sessions close decisively below $82,850, the structure will seek liquidity in the prior consolidation zone, where master support at $76,000** acts as the lower boundary of the current bullish structure.
The invalidation of the M2S pattern and the breakout above $82,850 resistance on institutional volume mark the transition into a clear bullish expansion phase in bitcoin. The lack of supply follow-through over the last four bars confirms that buyers control the market, with their eyes fixed on the $98,000 area.
Disclaimer: This analysis is strictly for educational and informational purposes based on price action reading. It does not constitute investment advice or financial planning. Cryptocurrency markets carry high volatility; always execute your own risk management.

Communications Professional. Crypto Enthusiast. Economic Journalist. Bitcoiner & Altcoiner.