Chainlink (LINK) posts a decisive bullish momentum over recent sessions on its daily chart, powerfully breaking key resistance at $14.24 after consolidating a double bottom pattern at $10.87. Driven by high trading volume and a two-legged bull structure, the asset challenges the upper market limits, leaving bear traps behind and opening a high-probability scenario toward medium-term targets.
Anatomy of a Reversal: The Double Bottom in Action
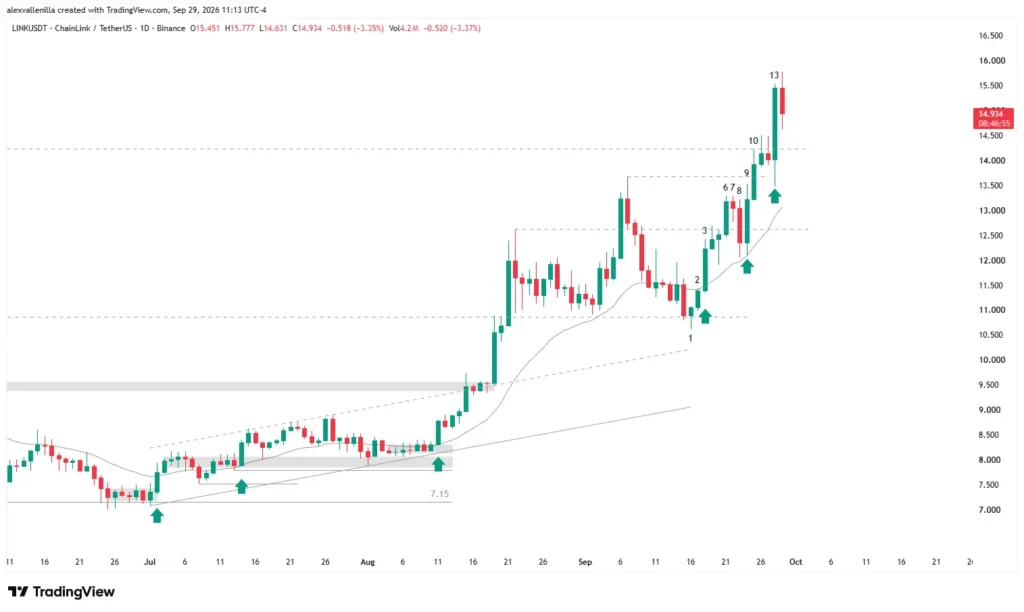
The cryptocurrency market rewards patience and punishes haste. Chainlink‘s recent bullish structure began shaping up at Bar 1, when prices tested support located at $10.87. This zone firmly halted a bearish correction that dragged the price down from $13.68.
Registering no further downside continuation, buyers defended the level, completing the sellers’ second failed attempt to breach this base. In price action, when a target fails twice, the market typically runs in the opposite direction.
Confirmation arrived immediately at Bar 2, where bulls validated support by closing above the previous high. However, Bar 3 delivered the masterstroke: a high-conviction bar with virtually no lower wick, accompanied by volume exceeding the 20-day average. This formation broke the prior bear microchannel and configured a High-2 (Hi-2) buy signal, instantly triggering buy stop-market orders at Bar 4.
The Battle for Resistances and the Bear Trap
After overcoming initial obstacles, momentum found a tactical pause at Bar 7 with a tweezer top pattern, though without piercing the newly acquired support at $12.62.
Bears tried capitalizing on this pullback during Bar 8, successfully plunging the price briefly below the control zone. Nonetheless, Bar 9 nullified any bearish intent by trapping premature sellers. Backed by solid volume and a gain exceeding 7%, this high-conviction bar pushed the price above $12.62, triggering a pullback failure that catapulted Bar 10 past the previous peak of $13.68.
Climactic Breakout and Current Scenario
The climax of this structure materializes at Bar 13. After testing the structural resistance zone at $14.24, buyers unleashed a high-conviction bar with a 10.18% gain, backed by massive trading volume.
However, this acceleration at the upper end of a two-legged move takes on characteristics of a FOMO-driven move (fear of missing out). Bar 14 currently reflects a natural technical pullback geared toward profit-taking, trading momentarily above newly conquered support at $14.24.
Surpassing the $14.24 barrier redefines Chainlink’s structural bias over the medium and long term. Invalidating the prior downtrend confirms buyer dominance, transforming supply zones into solid demand platforms and setting the stage to evaluate new macro targets.
Disclaimer: This article is for educational and informational purposes only and does not constitute financial or investment advice. The cryptocurrency market carries a high risk of volatility; trade at your own risk.

Communications Professional. Crypto Enthusiast. Economic Journalist. Bitcoiner & Altcoiner.