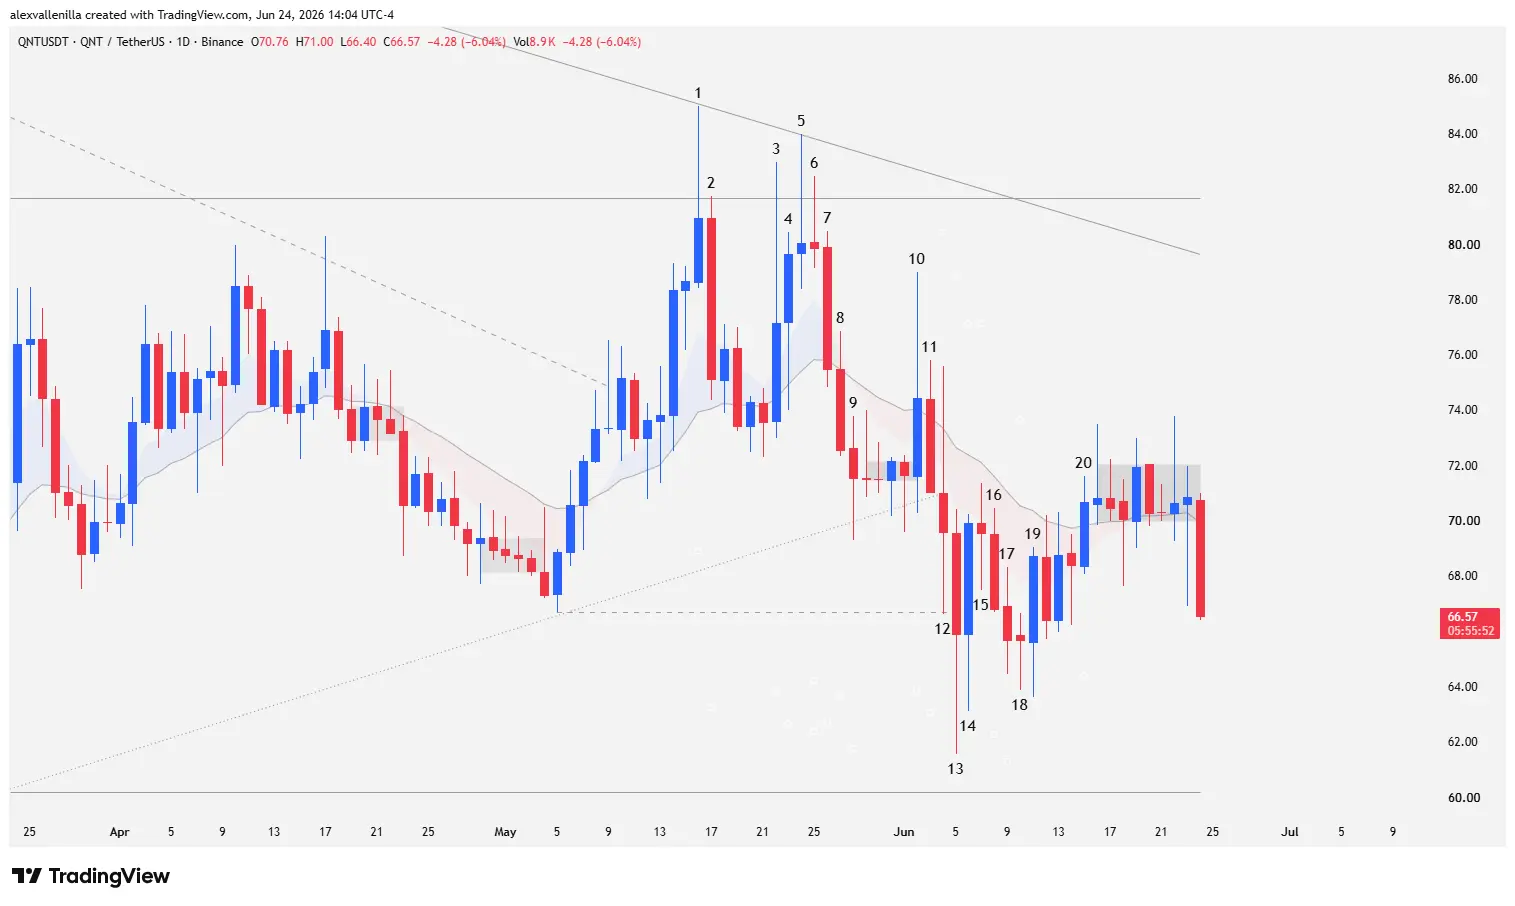
The digital finance market does not forgive structural exhaustion, and the Quant (QNT) ecosystem is currently delivering a masterclass in crowd psychology engraved right into the candlesticks. After attempting to shake off a prolonged bear market, the QNT token faces a harsh technical reality on the daily (1D) timeframe. The inability to sustain bullish breakouts above $81.66 turned buyers’ optimism into a severe liquidity trap, opening the door for smart money to reclaim control of the order flow.
So far in 2026, QNT posts a year-to-date loss of 3.87%, a drop that deepens to 16.56% over the past month, painting a worrying long-term picture with a 31.91% year-over-year decline. Are we looking at a definitive bottom or the prelude to a retest of critical macro support? The answer rests entirely on pure price action reading.
Chart Anatomy: A Radiograph of 20 High-Volatility Sessions
The Institutional Trap and the Birth of the New Down Channel (Bars 1 to 6)
Structural development begins at Bar 1, a textbook pin bar whose prominent upper tail pierces the $81.66 resistance only to close below it. This price action aborts a two-legged move up and sets up a bull trap. In addition to invalidating the breakout, the high of Bar 1 serves to anchor the prior 290-bar downtrend line, giving birth to a new 206-bar descending channel that, while showing a slower slope, maintains the bearish bias. By failing to exceed the previous pivot, Bar 1 becomes an EMA gap bar.
Bar 2 confirms institutional profit-taking with a high-conviction bearish candle that breaks the previous low, forcing an operational test of the 20-period exponential moving average (20 EMA) in the following sessions. Volatility explodes at Bar 3, where buyers manage to defend the 20 EMA, but the massive upper tail reveals heavy rejection when attempting to breach $81.66, failing to do so on the close. Following Bar 4, a broad-range inside consolidation bar, bulls take their final breath at Bar 5. This session prints another pin bar with a lower high relative to Bar 1, validating the upper band of the new 206-bar channel. By failing twice at the same target, the market triggers the principle of reverse symmetry. Bar 6 merely consolidates the buyers’ failure with a subtle pullback.
Low 2 Trigger and Local Support Capitulation (Bars 7 to 13)
Supply takes absolute control at Bar 7, a wide-range candle that closes clearly below the 20 EMA, confirming a double top pattern with lower highs. Mathematical confirmation of the move arrives with Bar 8, which breaks the low of the previous session and triggers a high-probability Low 2 short entry. Bearish order flow accelerates at Bar 9, triggering sell stops below Bar 8; however, dynamic support from a 118-bar counter-trend minor up-channel creates a long lower tail and opens a brief period of congestion.
Bar 10 attempts a violent reversal after the fakeout congestion, but its gigantic upper tail and another lower high prove that distribution continues. Bears respond by pushing price back under the 20 EMA at Bar 11. The Bar 12 session introduces extreme, expanded-range volatility; its tails on both ends liquidate leveraged positions while breaking down the 118-bar counter-trend channel, hitting the key local support and control point at $66.70 (a level undefeated for 31 sessions). Finally, Bar 13 executes the capitulation: it breaks the $66.70 support with force, though supply absorption at the lows creates a lower tail that temporarily halts the decline before reaching the critical $60.19 zone.
Deceleration, “Barbed Wire” Congestion, and the Current Candle (Bars 14 to 20)
Price attempts to stabilize between Bars 14 and 18. Bar 14 is a bullish inside bar with a lower tail looking to start a turn, but Bar 15 denies continuity and Bar 16 confirms the failed reversal by closing below the previous low. Bar 17 extends the drop with a shrinking body, denoting a loss of selling momentum. This weakness materializes at Bar 18, a tiny-bodied pin bar with a higher low relative to bars 13 and 14, completing a deceleration cycle that attracts short-term buying.
Bar 19 acts as an outside bar that confirms the buying pressure accumulated in the previous tails, though it lacks the momentum to test the 20 EMA. After a brief pause, Bar 20 manages to cross above the 20 EMA, printing higher lows. However, momentum immediately dissolves, trapping price for the next eight sessions in a severe congestion pattern known in Price Action methodology as barbed wire.
Current Situation: Bears Break the Sidewalk Action
At the time of writing, the developing daily candle trades with strong bearish conviction, printing at $66.00 with an intraday decline of over 6%. This candle cleanly breaks the base of the barbed wire pattern, resolving the previous indecision in favor of supply and validating the continuity of the larger bearish structure within the 206-bar channel.
Structural Outlook and Market Projections
Bears continue to dominate the macro outlook for QNT. With the lower-high double top validated against the $81.66 resistance, the bearish bias remains intact.
Bearish Scenario (Higher Probability): If the current candle closes decisively below the congestion zone, order flow will inevitably push price toward a formal test of the macro local support at $60.19. The fact that the market did not hit this level during the Bar 13 drop suggests it remains a pending liquidity magnet.
Bullish Scenario (Requires Confirmation): To invalidate the corrective structure, bulls must defend the current area and propel price toward the top of the descending channel, where dynamic resistance currently sits at $79.64. Only a sustained breakout and subsequent consolidation above the key $81.66 pivot would shift the medium-to-long-term bias, clearing the path toward the next institutional resistance at $108.37.
Disclaimer: The analysis contained in this article is provided for informational and educational purposes only, based on price action methodology. It does not constitute, nor should it be interpreted as, investment advice, financial endorsement, or a recommendation to buy or sell any digital asset.
Communications Professional. Crypto Enthusiast. Economic Journalist. Bitcoiner & Altcoiner.