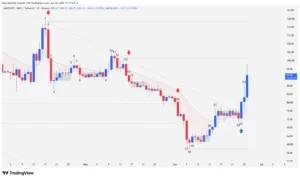
AAVE completed a violent structural reversal on its daily chart after sweeping liquidity from the last two years. Selling pressure culminated in a max capitulation that forced the price to establish critical support at $57.83. However, the subsequent influx of institutional volume—known in order flow as “smart money”—triggered a two-legged rally that definitively broke the 161-session bearish trendline. At the time of writing, the token trades above $93.00, posting a 12.96% intraday rally and consolidating a deep shift in market psychology.
Macro Chart Context: The Deep Liquidity Hunt
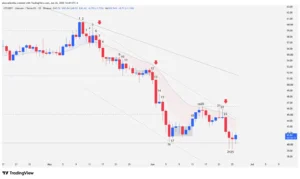
To understand AAVE‘s current move, analyzing the prior structure is crucial. The crypto asset was developing a 161-bar bearish trend, structured as a descending channel that was slower than the preceding 191-bar downward impulse.
Because buyers failed to reach and test key resistance at $180.12, the market ran out of bullish momentum. By the laws of price action, when bulls fail to test the upper boundary of a structure, price symmetrically seeks liquidity at the bottom. This inertia dragged the price down, piercing local support zones to visit levels not seen in the last 783 bars (over two years), setting the ideal stage for a large-scale bear trap.
Price Action Narrative: Bar-by-Bar Analysis
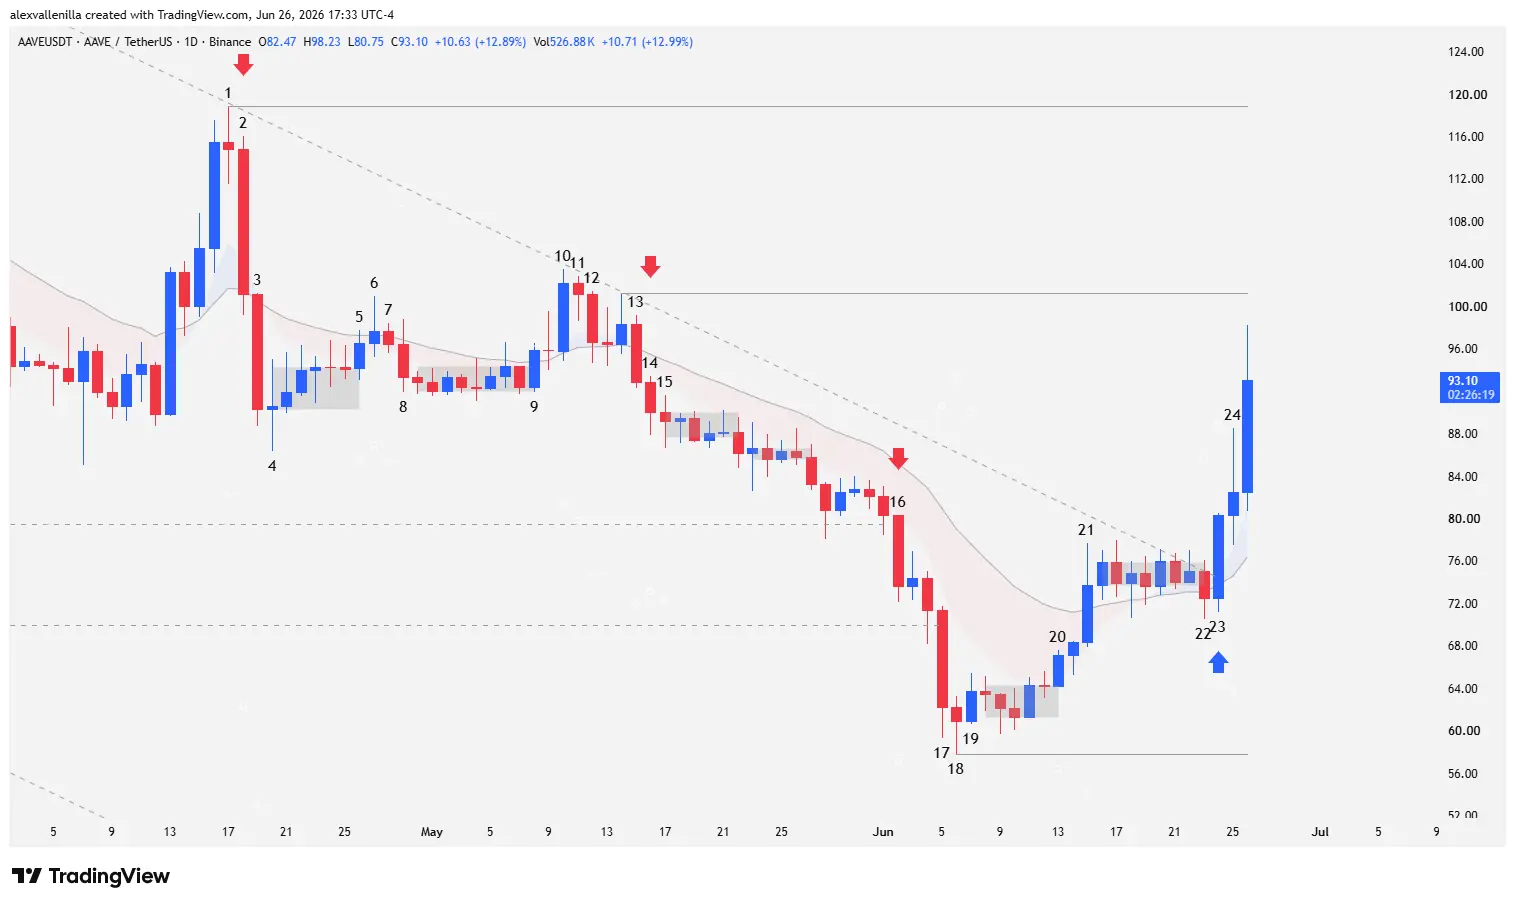
Price behavior on the daily (1D) timeframe details a classic transition from bearish distribution and capitulation to accumulation and subsequent buyer expansion.
Phase 1: Loss of Support and Initial Stagnation (Bars 1 to 4)
Bar 1: Halts the previous bullish momentum. The market prints a high-volatility, indecisive doji. Its high establishes a fixed resistance at $118.87 and serves as the anchor point to draw the descending trendline of the 161-session channel.
Bar 2: This powerful, high-conviction bear trend bar breaks sharply below the 20-period exponential moving average (20 EMA), trapping late buyers.
Bar 3: A bearish continuation candle confirms smart money pressure. Almost its entire body closes below the 20 EMA, injecting a second highly decisive bearish impulse.
Bar 4: Bulls temporarily halt the drop with a doji, bringing back indecision and initiating a congestion phase at the base of the structure.
Phase 2: The Fake Bullish Breakout (Bars 5 to 11)
Bar 5: Breaks the previous congestion pattern and tests the 20 EMA to assess demand strength.
Bar 6: Buyers attempt to follow through on the breakout but fail prematurely. They print a candle with an upper wick representing 30% of its range, closing barely above the moving average.
Bar 7: An inside bar stalls the bullish continuity and sets up an immediate retracement in favor of the main trend.
Bar 8: Confirms the reversal downward, pushing the price back below the 20 EMA and submerging the market into a dense, eight-session “barbed wire” congestion.
Bar 9: Breaks the congestion pattern to the upside, keeping the price action sideways since Bar 4.
Bar 10: After a failed pullback, bulls set up a high-probability buy pattern (a High 2). It closes with high conviction above the 20 EMA. However, sitting at the top of the 161-bar channel and hitting dynamic resistance, it represents a counter-trend trade with low probabilities of success.
Bar 11: Another inside bar favoring the macro bias. By failing to exceed the high of Bar 10, the market does not trigger the buy stop orders placed above that level, turning into a pullback candle.
Phase 3: Market Reversal, Low 2, and Climactic Capitulation (Bars 12 to 18)
Bar 12: Smart money prints a high-conviction institutional sell candle. It breaks the lows of the two previous bars, completely invalidating the bullish setup.
Bar 13: A bearish conviction candle with a lower high and a close below the 20 EMA, offering a powerful signal of trend resumption.
Bar 14: This bearish candle breaks the previous low and triggers a high-probability sell pattern (a Low 2). It is highly reliable due to the institutional backing from Bars 12 and 13.
Bar 15: Breaks the low of the previous bar, triggering pending sell stop orders in the market. The price enters a brief pause before breaking lower once again after a minor breakdown.
Bar 16: A powerful bear bar, virtually “shaved” at its top (no wick), denoting absolute seller control from the open. It pierces support at $79.51 (the previous structural low), formally confirming the bearish resumption. A subsequent bullish absorption attempt fails, attracting more shorts.
Bar 17: Climactic Candle. It features a body substantially larger than all previous bars. It represents the capitulation phase of the move, piercing historical support from over two years ago (783 bars). The small lower wick denotes the beginning of supply absorption at discount prices.
Bar 18: Bears attempt to continue the drop but fail to close below the previous low. The price rejects heavily to the upside, printing a pinbar (hammer) with a large lower tail. This low establishes the definitive floor at $57.83.
Phase 4: Structural Reversal and Institutional Entry (Bars 19 to Current Bar)
Bar 19: Bulls trigger the reversal by breaking above the high of Bar 18, holding support at $57.83 and leading into a five-session consolidation.
Bar 20: Breaks out of the consolidation zone, a move validated by the subsequent bar exceeding its high.
Bar 21: A bullish acceleration candle that pierces the 20 EMA. It shows partial profit-taking with a 30% upper wick, leading into a seven-session sideways range that respects the 20 EMA as new dynamic support.
Bar 22: An attempt by bears to resume the trend via a breakdown. However, its low is notably higher than that of Bar 18, laying the theoretical foundation (higher low) for building a new bullish channel.
Bar 23: Institutional Conviction Bar. Bulls surprise with a massive, wide-range candle that reveals smart money entry. Sellers from Bar 22 are trapped (short squeeze), serving as fuel for the move. This candle violently breaks the main 161-bar descending trendline, keeping the price above the 20 EMA.
Bar 24: Confirms the trendline breakout by closing above the high of Bar 23, validating the previous bear trap despite surrounding volatility.
Current Bar: A wide-range expansion candle in progress. At the time of this report, it drives AAVE above $93.00 with a 12.96% gain, confirming the strength of the second bullish leg in this accelerated reversal move.
Technical Projections and Market Targets
The current behavior validates a shift in trader psychology for the short and medium term. By breaking the macro trendline and clearing the congestion zone through a bear trap, buyers open up the path to target the following technical objectives:
Primary Bullish Scenario: If the current momentum sustains, the first local resistance to test sits at $101.24. A volume-backed breakout above this level will open the doors to target key resistance at $118.87 (the origin of the structure at Bar 1). A solid close above this final threshold would confirm a long-term structural trend change.
Retracement Scenario: If the market finds a ceiling in the immediate resistance zone at $101.24 and fails to follow through, price will seek support in demand zones. The key horizontal support and definitive floor of the structure remains firm at the $57.83 area.
AAVE executed a textbook price action maneuver: a massive capitulation at historical support levels to sweep late positions, followed by an injection of institutional capital that trapped short sellers. The breakout of the 161-bar bearish channel and sustained positioning above the 20 EMA suggest that the decentralized finance token has completed its bottoming phase and started a bullish recovery cycle with solid structural foundations.
Disclaimer: This analysis is strictly for informational and educational purposes. It does not constitute financial advice, an investment invitation, or a recommendation to buy or sell digital assets. Cryptocurrencies are highly volatile assets; only risk capital you are willing to lose.
Communications Professional. Crypto Enthusiast. Economic Journalist. Bitcoiner & Altcoiner.