

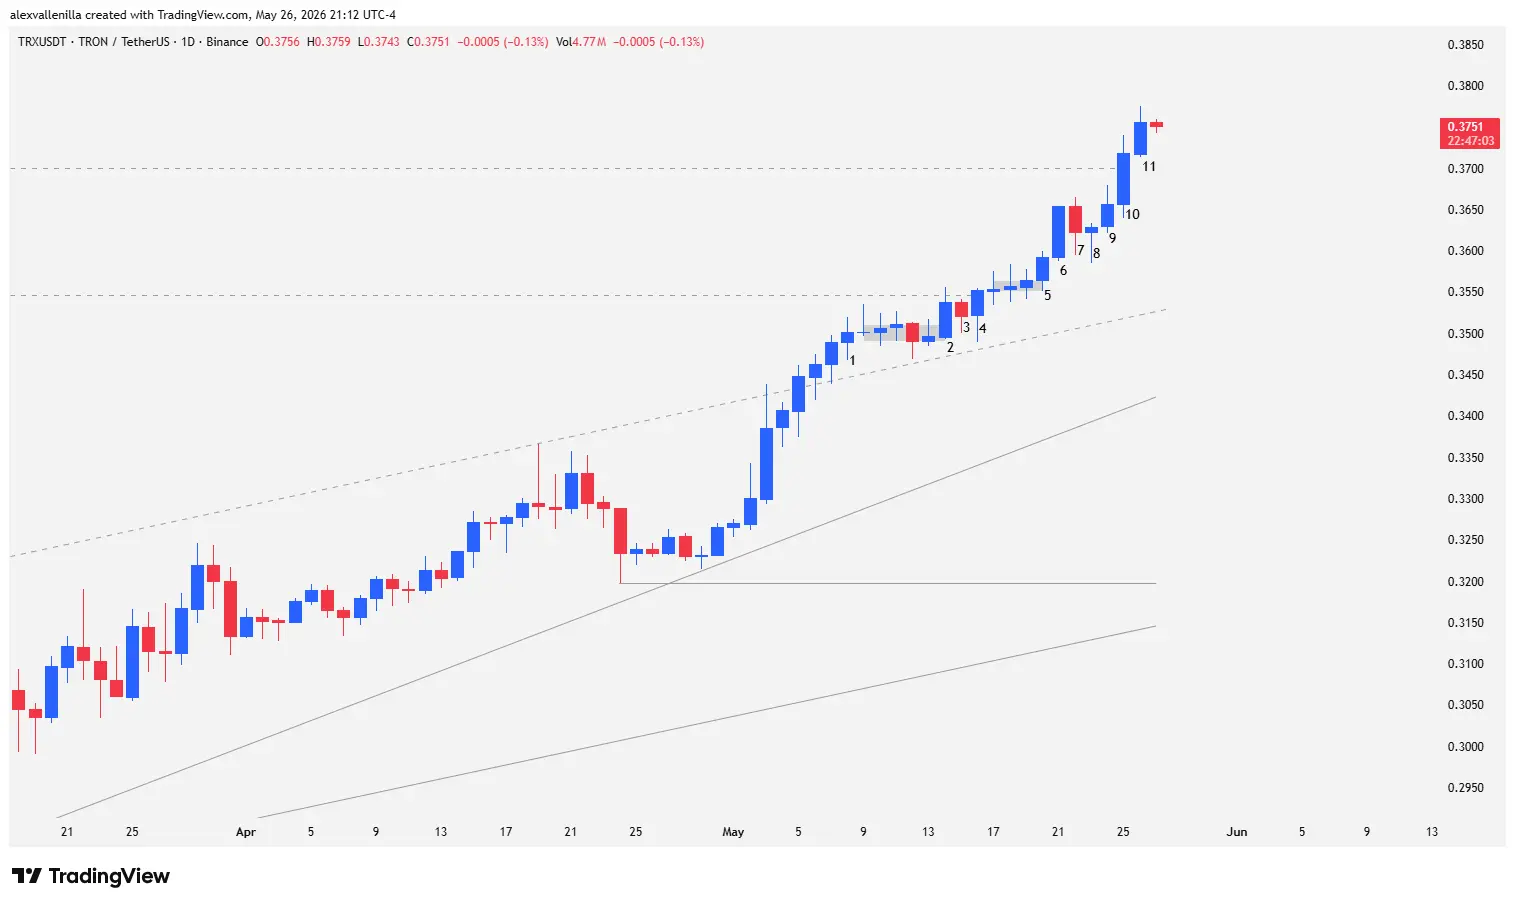
In a display of strength that defies market fatigue dynamics, Tron (TRX) consolidated a decisive bullish breakout on its daily (1D) chart. The crypto asset validated the exit from the upper boundary of a 110-bar macro ascending channel, flipping former resistances into dynamic supports. After piercing the critical congestion zone and neutralizing selling pressure at $0.3547, institutional order flow (the “smart money”) propelled the price above the psychological resistance of $0.3700. This move not only culminates the recovery from the previous bearish structure but also technically clears the path toward a retest of its all-time high in the $0.450 region.
The Macro Context: A Silent but Relentless Acceleration
The current TRX price action is not an isolated event, but the maturation of a long-term structure. The asset moves within a major uptrend spanning 988 bars, exhibiting remarkable technical health.
Recently, this trend experienced an acceleration following the bullish resolution of a rising wedge combined with a micro-channel breakout. Unlike retail rallies characterized by expanded-range candles (short-lived explosive blocks), the current advance is built on small but steady bullish bars. This behavior reveals institutional accumulation and absolute control by buyers, who systematically absorb supply without allowing significant pullbacks.
Price Action Breakdown: Bar-by-Bar Analysis
The Battle at the $0.3547 Frontier (Bars 1 to 4)
Bar 1: This small bullish bar confirmed the breakout of the upper side of the 110-bar channel and the apex of the rising wedge. However, supply reacted immediately, confining the price to a sideways congestion pattern (barbed wire) just below the $0.3547 resistance.
Bar 2: Buyers took the initiative with a bullish bar featuring a marubozu base (completely shaved at its low). This demonstrates strong buying conviction from the open. Although the high pierced a 245-bar historical resistance that had never been tested before, the close remained below that level, validating the bears’ defense.
Bar 3: A bearish inside bar reflecting consolidation. Its inability to generate a deep pullback exposed the scarcity of sellers willing to trade at lower prices.
Bar 4: A bullish outside bar with a prominent lower wick. This candle executed a bear trap by absorbing the short orders from Bar 3, confirming the failed pullback. By closing slightly above $0.3547, the market entered a brief pause of three dojis that kept the price above the breached level.
Continuity and Institutional Dominance (Bars 5 to 9)
Bar 5: A modest but tactically key upward move. It managed to break the previous mini-congestion and closed above the doji highs.
Bar 6: A highly efficient expanded-range bar. Its geometry, with virtually no lower wick and completely shaved at its top, evidences institutional urgency. Showing no overlap with previous structures, it provided continuity to the breakout and validated the old channel ceiling as new floor.
Bar 7: A correction attempt that ended up demonstrating bearish weakness. Buyers quickly absorbed the supply, leaving a lower wick the size of the body. Crucially, the low of this bar printed above the low of Bar 6, maintaining the sequence of higher lows.
Bars 8 and 9: Bar 8 neutralized any selling continuity from the preceding candle, triggering a failed pullback that attracted buying flow. Bar 9 confirmed this scenario with a bullish close that resumed upward pressure.
The Fall of the Last Bearish Bastion (Bars 10 and 11)
Bar 10: A high-impact breakout bar where volatility expanded. Despite printing minor wicks on both ends, control remained firmly with demand. Its higher low relative to Bars 8, 5, and 4 confirmed smart money positioning at higher and higher prices. Most importantly, the close sat above the key resistance of $0.3700, the last bastion of the former macro downtrend.
Bar 11: The confirmation candle. A moderate-advance bullish bar whose low strictly respected the $0.3700 level as new horizontal support.
Technical Projections and Control Zones
With the confirmation of Bar 11, the Tron market structure completed its recovery cycle and enters discovery territory.
If the current momentum sustains, the price has a clear path to seek a formal test of its all-time high in the $0.450 zone.
In the alternative scenario where the current pace slows and the bulls need to catch their breath, risk management requires monitoring the key support zone at $0.3547 (former horizontal resistance). This area aligns exactly with the upper side of the ascending channel, acting as a dynamic support at $0.3530. As long as the price trades above this liquidity cluster, the bullish bias for TRX remains intact.
Tron executed a textbook structural transition. Supply absorption at critical levels and the uninterrupted sequence of higher lows prove that institutional capital is leading the move. Clearing $0.3700 marks the end of the previous bearish era and puts TRX in a prime position to challenge its all-time records.
Disclaimer: This analysis is issued exclusively for informational and educational purposes based on Price Action methodology. It does not constitute financial advice, investment recommendation, or an offer to buy or sell digital assets. Crypto assets exhibit high volatility; perform your own risk analysis before trading.

Communications Professional. Crypto Enthusiast. Economic Journalist. Bitcoiner & Altcoiner.


