

Injective (INJ) is trading above the $5.00 barrier, driven by a solid price action-based recovery on its 1-day chart. After completing a two-legged bearish corrective pattern at the $4.02 support and validating a high-probability breakout above the 20-period Exponential Moving Average (20 EMA), buyers are pushing the asset with a daily gain exceeding 5%. This move challenges previous highs and opens a direct path toward the key $6.10 resistance level.
Market Structure: From Bull Trap to Wedge Formation
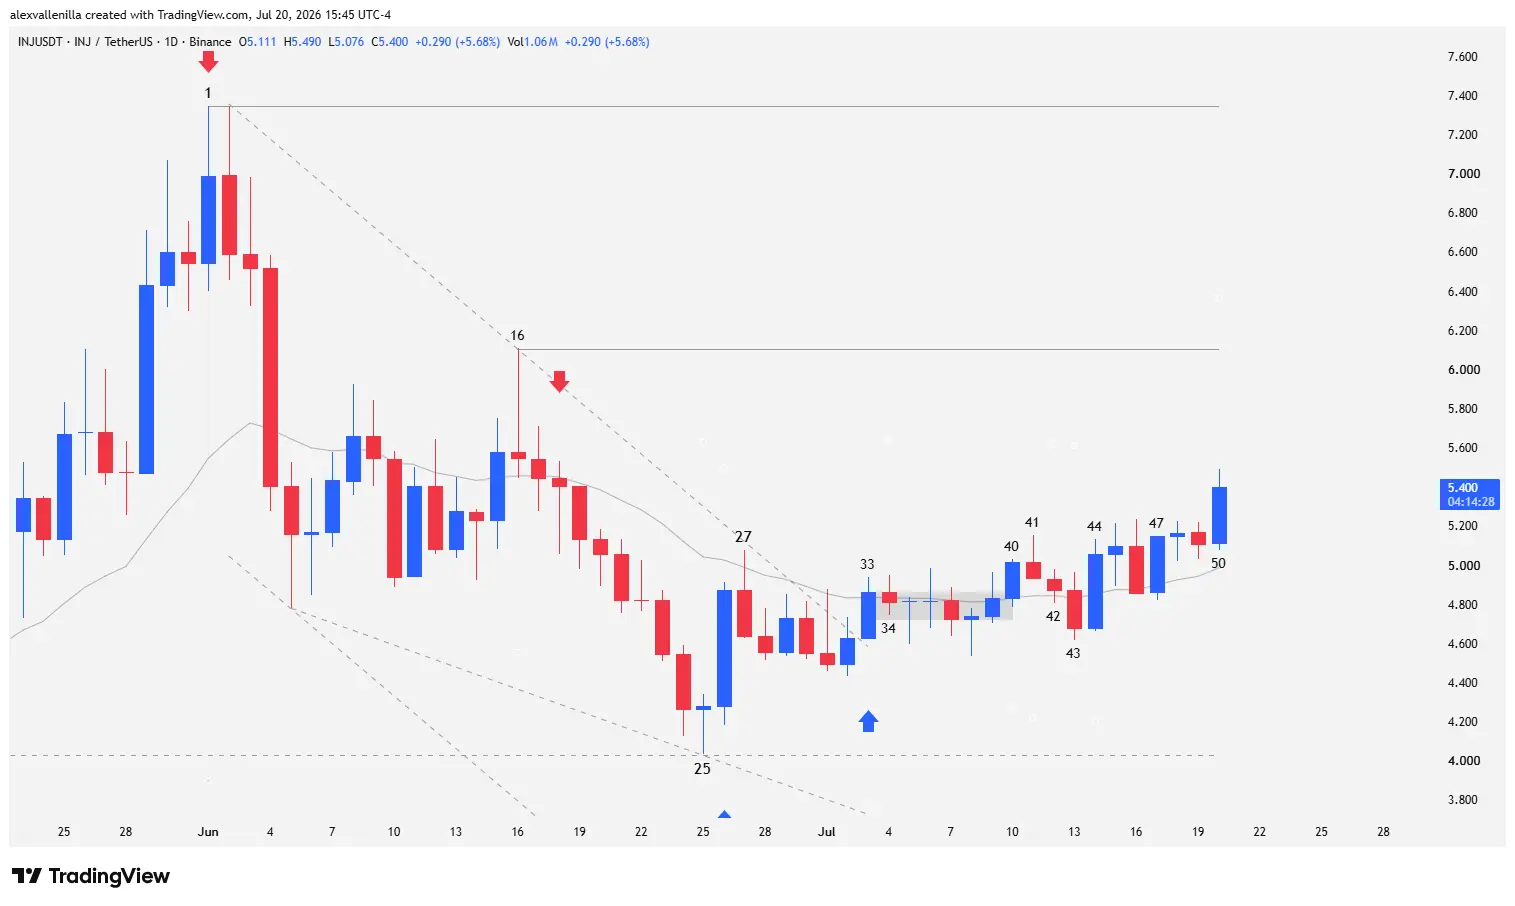
The technical context for INJ shows a significant structural shift. In Bar 1, the market executed a classic bull trap by slightly overshooting the critical $5.90 resistance. This movement generated FOMO (fear of missing out) among late-buying retail traders, turning that candle into an EMA gap bar typical of a “sell the rally” setup.
The subsequent selling pressure resulted in a breakdown below the 20 EMA, forming a two-legged correction. However, the second leg down lost momentum between Bars 16 and 25. Small candles, constant overlapping, and lower tails evidenced clear supply exhaustion.
The Bar 25 pivot marked the floor of the correction, precisely respecting horizontal support at $4.02—a previous range resistance. The confluence of this level with the lower boundary of a descending channel framed a falling wedge with high-probability bullish implications.
Price Action Technical Analysis: Bar-by-Bar Breakdown
Initial Breakout and Micro-Range Above the 20 EMA
Bar 33 acted as the trigger for the structural shift. This high-conviction bull candle surged through the 20 EMA and broke the short-term downtrend line. At the same time, it confirmed a high-probability High 2 signal, officially ending the corrective cycle that began at Bar 25.
Following Bar 34, which delivered follow-through without triggering significant seller counterattacks, price compressed into a micro-range. Candles remained intertwined directly above the 20 EMA until Bar 40, where buyers attempted an upside breakout with a narrow-range candle.
The Bear Trap and Supply Flush (Bars 41 to 43)
Bar 41 temporarily trapped aggressive bulls by showing a prominent upper tail relative to its body. Bar 42 confirmed the pullback by closing below the low of Bar 41, though sellers failed to close price below the 20 EMA.
In Bar 43, bears accelerated and printed a close below the 20 EMA, breaking the prior low. However, the narrow range of this candle revealed a distinct lack of selling liquidity. Crucially, the low of Bar 43 established a Higher Low compared to Bars 32 and 25, keeping the chart’s bullish bias fully intact.
Institutional Reversal and Push Toward Resistance (Bars 44 to 50)
Smart money re-entered aggressively in Bar 44. This candle presented a completely shaved bottom, demonstrating that buy orders absorbed supply right from the open. Bar 44 invalidated the highs of Bars 42 and 43, trapped short sellers, and reclaimed a close above the 20 EMA.
Bar 45 consolidated the position with a doji that kept price above the moving average. After a brief breather, Bar 47 trapped unsuspecting supply once again. This candle displayed absolute buyer control from start to finish, printing a minimal lower tail and a total absence of an upper tail.
Finally, after two light retail consolidation candles (Bars 48 and 49), Bar 50 squeezes positions in real time. Price penetrates $5.00 with an intraday rally of over 5%. The high of Bar 50 surpasses the Bar 27 pivot and the entire prior structure, opening direct order flow toward the resistance zone.
Operational Scenarios and Outlook
Dominant momentum positions Injective with a clear near-term bullish bias. The primary target is a test of $6.10, which corresponds to the high of Bar 16 (the control point for the last major downward push).
Bullish Scenario: If buyers sustain volume and break through $6.10, INJ will project its move toward secondary resistance at $7.34. Consolidation between these two levels would mark the definitive neutralization of the main downtrend.
Rejection Scenario: If price faces rejection at $6.10, the dynamic support to monitor sits right at the 20 EMA, currently located at $4.98.
Disclaimer: This analysis is strictly for educational and informational purposes and does not constitute investment advice, financial counsel, or an offer to buy or sell digital assets. The cryptocurrency market carries high volatility. Conduct your own research (DYOR) and evaluate your risk tolerance before making financial decisions.

Communications Professional. Crypto Enthusiast. Economic Journalist. Bitcoiner & Altcoiner.


