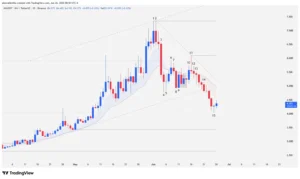
The cryptocurrency market shows no mercy to false optimism, and the recent price action of the INJ (Injective) token on its daily chart (1D) is a textbook example of how a bull trap can completely reshape an asset’s technical structure. After attempting to consolidate a macro trend reversal to leave behind a 152-bar bear winter, selling pressure at a key resistance zone crushed buyers’ aspirations. The breakout below the main ascending channel opens the door to a deeper correction, though the latest candles suggest potential exhaustion in the sell order flow at critical levels.
The Anatomy of the Deception: From Euphoria to Capitulation
The INJ narrative began with optimism. Price completed a two-legged upward impulse within an ascending channel structured over 69 bars. The primary objective was to consolidate the breakout above the $5.90 resistance—a vital technical zone representing the last relevant lower high of the prior 152-bar downtrend.
However, the market failed to maintain momentum. What appeared to be the birth of a medium-term bull cycle quickly turned into heavy buying absorption. Price invalidated the key $5.90 support, turning the breakout into a trap and triggering a two-legged bearish move that culminated in a bearish breakout below the channel’s trendline.
Technical Price Action Analysis
To understand trader psychology and order flow, we analyze the numerical sequence of the price action bar by bar:
The Origin of the Trap and the Shift in Order Flow (Bars 1 to 3)
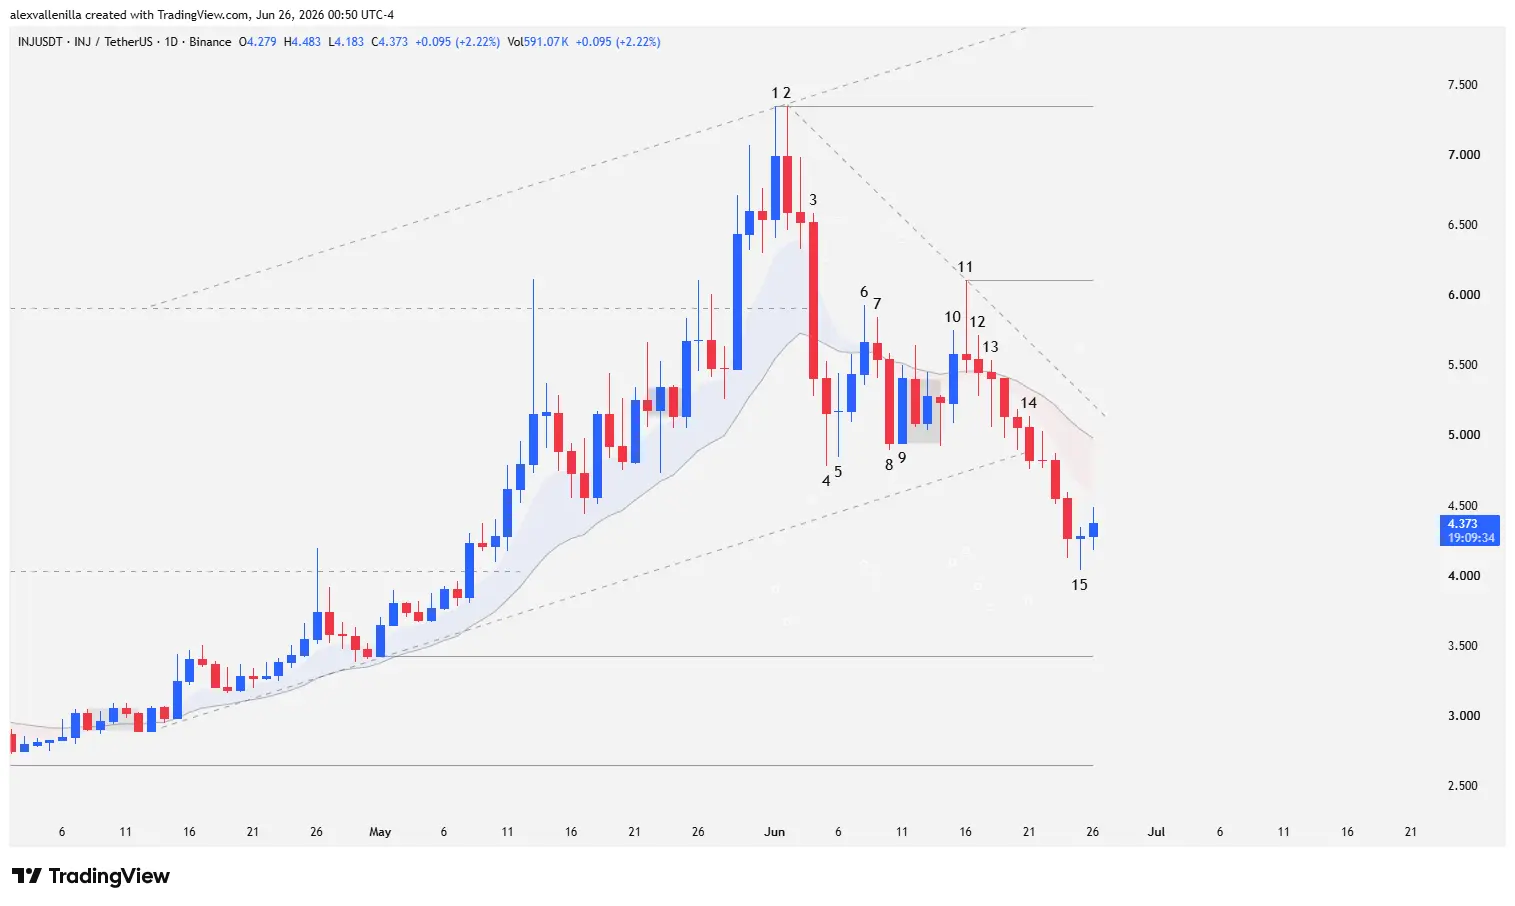
Bar 1: This bullish candle capped the two-legged impulse and established the top of the 69-bar channel. However, it left a prominent upper tail, revealing profit-taking and the entry of supply. The high set a critical resistance at $7.34, well above the old key level of $5.90.
Bar 2: Buyers failed to deliver follow-through. The candle mirrored a tweezer top pattern with a significant upper wick, confirming heavy selling pressure.
Bar 3: A powerful, high-conviction bearish trend bar expanded the range. The close of this session broke below the 20-period exponential moving average (20 EMA) and dragged the price back below $5.90. This officially sealed the bull trap and invalidated the support.
The First Bearish Leg and Trading Range (Bars 4 to 9)
Bar 4: The violent sell-off continued. Despite the strength, an inferior tail showed that buyers absorbed some supply at the lows, halting just before testing the bottom of the ascending channel.
Bar 5: This acted as an inside bar consolidation, temporarily pausing the bearish momentum.
Bar 6: Bulls attempted a counterattack via a three-bar reversal pattern that reclaimed the 20 EMA. However, lack of volume and low conviction in the candles exposed the weakness of the move.
Bar 7: A new bearish inside bar generated an immediate failed reversal, aborting the bullish follow-through above the 20 EMA.
Bar 8: Bears confirmed the failure with a wide-range bearish candle that closed below the 20 EMA. Despite this, the low remained higher than that of Bar 4, still respecting the main trendline.
Bar 9: This opened a three-bar sideways trading range with no clear direction, compressing the price very close to the 20 EMA.
The Failed Breakout and the Final Blow (Bars 10 to 14)
Bar 10: An expanded-range candle broke above the tight trading range and the 20 EMA, marking a second attempt by buyers to reclaim the structure.
Bar 11: Total failure. A bearish pinbar formed with a massive upper tail. Price failed to close above the previous high, signaling a failed bullish breakout and establishing the trendline of a minor counter-trend descending channel with local resistance at $6.10.
Bar 12: This confirmed the rejection by closing below the low of Bar 11, sinking the price back below the 20 EMA.
Bar 13: This presented a Low 2 short setup. Although it showed a large lower tail from buying absorption and a higher low than Bars 4 and 8, the market’s intrinsic weakness set the stage for the second bearish leg. The subsequent bar triggered sell stops by breaking its low.
Bar 14: This marked the capitulation. It closed strongly below the lower line of the 69-bar ascending channel. After a brief consolidation phase in the following sessions, the price confirmed a measured move equivalent to the initial impulse of Bars 2 to 4, entering a “bears in the clear” phase.
Signs of Capitulation and Macro Support (Bar 15)
Bar 15: Buyers stepped in to stop the bleeding, printing a reversal candle whose lower tail far exceeded the size of its real body. The session low halted its descent just before touching key support at $3.42, the control point of the previous major uptrend.
Market Outlook: What to Expect Next for INJ?
The price of INJ is currently trading under the direct influence of a 25-bar minor descending channel, stemming from the major channel breakout. Structurally, the two-legged bearish move seems to have completed its projected technical cycle after Bar 14, opening the possibility that Bar 15 represents the climax and exhaustion of this deep correction.
For bulls to build a credible narrative shift, order flow must hold above the recent lows. The first technical challenge sits at the dynamic resistance of $5.13, where the minor descending channel trendline and the 20 EMA converge. A clean breakout above this zone would reactivate buying interest, targeting a test of $6.10 to evaluate if the market has enough liquidity to initiate a genuine bull cycle. Otherwise, if selling pressure persists, a retest of the macro support at $3.42 remains inevitable.
Disclaimer: This analysis is presented for informational and educational purposes only. It does not constitute financial advice, investment recommendations, or an offer to buy or sell digital assets. Cryptocurrencies carry a high risk of volatility; perform your own research before trading.
Communications Professional. Crypto Enthusiast. Economic Journalist. Bitcoiner & Altcoiner.