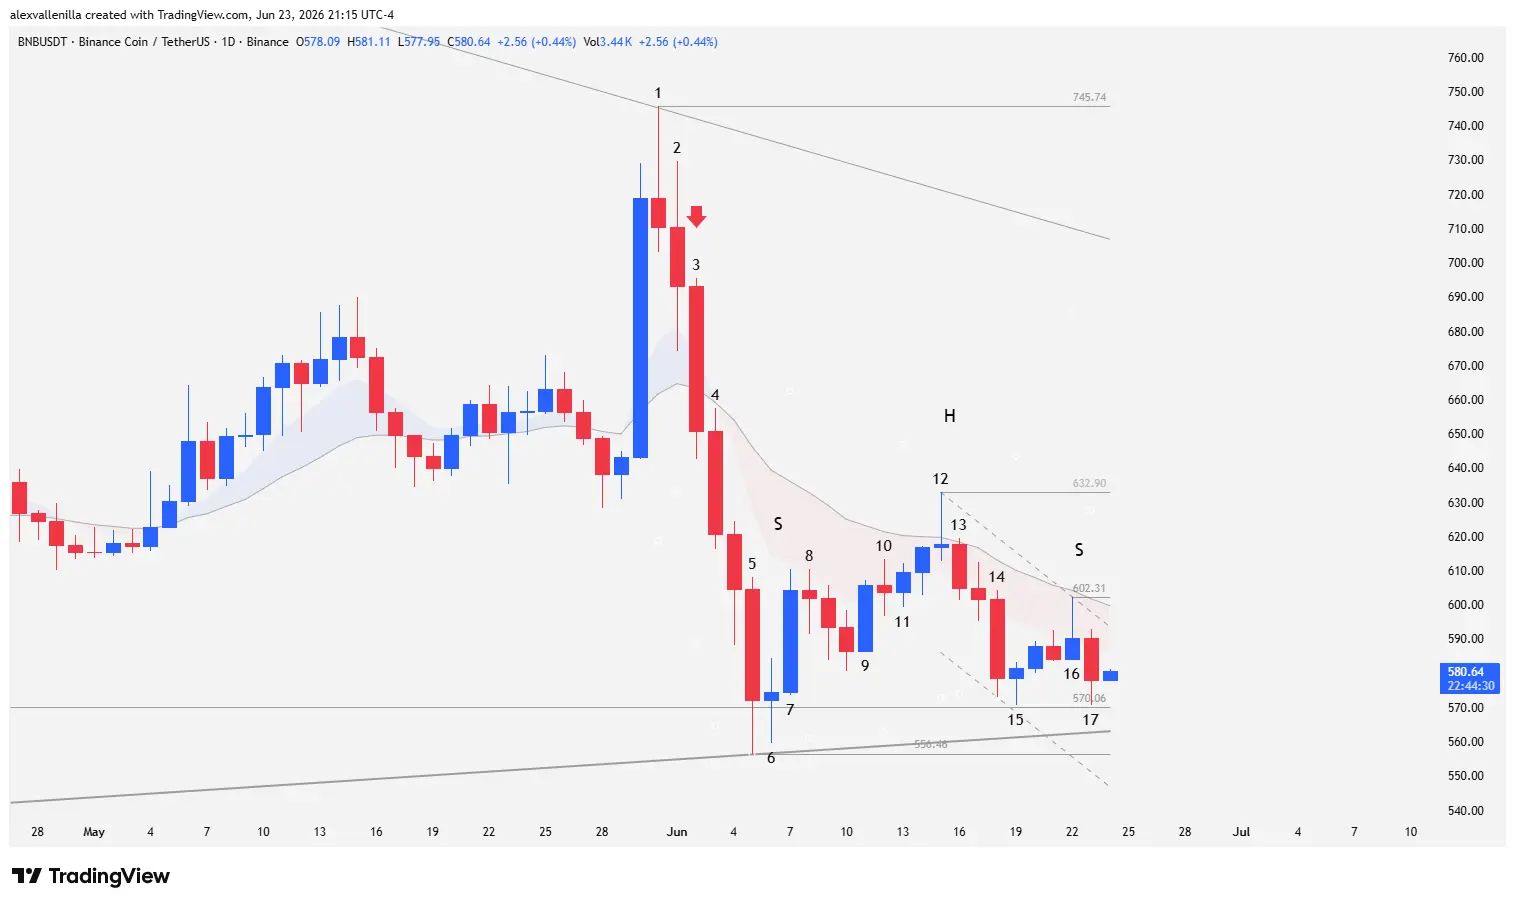
The cryptocurrency market faces a decisive week, and Binance Chain (BNB) has become the epicenter of technical analysts’ attention. Following a prolonged bearish move stretching over 158 sessions on the daily chart (1D), the crypto asset fights a crucial psychological and structural battle. The inability of buying forces to consolidate a long-term structure shift has left the price trapped in a high-compression zone. Currently, the price tests magnetic support at $570.06, a level that defines the boundary between a “double bottom” accumulation or a bearish capitulation toward the $520.00 zone.
Bull Trap and the Beginning of the Institutional Exodus
The recent decline began after a failed attempt to reverse the macro bearish structure. Buyers attempted to deploy a rally aiming to validate key resistance at $790.79—a former historical support turned into a ceiling. However, institutional order flow shifted drastically before reaching the target, altering price action dynamics.
The Structural Rejection Catalyst
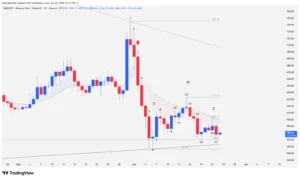
Bar 1 (Reversal Pinbar): This session acted as a bull trap. By failing to provide continuity to the previous climatic momentum, it established local resistance at $745.74, while anchoring a 158-bar downward trendline. Closing with an obvious gap relative to the moving average, it set up as an EMA gap bar, triggering selling algorithms under the premise of “sell the rally.”
Bar 2 (Reversal Confirmation): Volatility returned with force. The close of this candle below the low of Bar 1 formally confirmed the market reversal and invalidated the buying momentum.
Bears on the Run and Order Flow Acceleration
Bar 3 (High-Probability Low 2): A solid, high-conviction bearish candle without significant tails, demonstrating absolute control by smart money. By piercing and closing below the 20-period EMA, it triggered a Low 2 short setup in the direction of the major trend.
Bar 4 (Bears on the Run): Breaking the previous session’s low triggered automated sell orders, extending the crash for five consecutive sessions in a classic “bears in the woods” scenario.
Technical Analysis: The Battle at Major Support and H&S Geometry
A detailed analysis of the price action between Bars 5 and 17 reveals a transition from a climatic capitulation into a distribution pattern with immediate bearish implications.
Bars 5 to 7: Absorption and the Double Bottom Feint
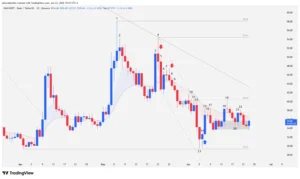
Bar 5 registered as an extended-range climatic candle that momentarily pierced key support at $570.06 (the last structural low of the previous bear market). However, the appearance of a prominent lower tail evidenced supply absorption when interacting with the lower line of a major 936-bar ascending channel. Smart money halted the decline temporarily, suggesting a potential “double bottom.”
Bar 6 (a narrow-range doji and inside bar) paused the bleeding by failing to trigger sell stops below Bar 5. This led to Bar 7, where bulls re-entered the market, invalidating the previous sell signal by clearing the high of Bar 5, though lacking the volume and range needed to declare absolute buying conviction.
Bars 8 to 13: Compression and Failures at the EMA 20
The recovery attempt lacked institutional liquidity. Bar 8 (doji) stalled the ascent, opening the path for a weak three-candle retracement with narrow bodies and tails on both ends. Although Bar 9 marked a higher low, trapping lagging sellers, uncertainty persisted into Bar 10 (doji) and Bar 11 (an inside bar pullback failure).
By Bar 12, bulls attempted to storm the 20-period EMA, but supply blocked the move, leaving local resistance at $632.90. The immediate loss of this level in Bar 13 confirmed the bearish bias and validated the failed moving average breakout.
Bars 14 to 17: Setting Up the Head-and-Shoulders (H&S) Structure
Selling pressure accelerated in Bar 14, a climatic candle that nevertheless failed to test the $570.06 floor. Again, the lack of continuity in Bar 15 (bullish pinbar) attempted to restructure the buying defense.
However, the bearish verdict was sealed between sessions 16 and 17:
Bar 16: Attempted to test the EMA 20 but closed with an upper tail twice the size of its body, establishing resistance at $602.31 and serving as an anchor for a 9-bar micro downward trendline.
H&S Geometry: This rejection completed a Head-and-Shoulders (H&S) pattern, where the high of Bar 12 functions as the Head, the high of Bar 7 as the Left Shoulder, and Bar 16 as the Right Shoulder.
Bar 17: A bearish session that validated the H&S structure, pressing the price back toward the neckline located at the $570.06 support.
Resolution Scenarios: Invalidation or Capitulation Toward $520
The market is compressed into a critical vertex of lower highs against unbreakable short-term horizontal support. The resolution of this structure will determine BNB’s direction for the next quarter.
Bullish Scenario (Structure Failure): If buying order flow successfully defends $570.06 and drives a daily close above local resistance at $602.31, the H&S formation will be completely invalidated. The failure of a mature bearish structure usually triggers a violent short squeeze, offering an optimal institutional buy signal to target the upper levels of the range again.
Bearish Scenario (Geometric Projection): If the price breaks through the $570.06 support with body and volume, the technical target of the H&S will trigger. Measuring the distance from the peak of the head ($632.90) to the neckline and projecting it downward, the technical target aligns with mathematical precision with the next macro support at $520.00.
Disclaimer: This analysis is presented for informational and educational purposes only. It does not constitute financial advice, an investment recommendation, or an offer to buy or sell digital assets. Crypto assets exhibit high volatility; perform your own research before committing capital.
Communications Professional. Crypto Enthusiast. Economic Journalist. Bitcoiner & Altcoiner.