

The crypto market closely monitors AAVE price behavior on its daily chart (1D). After completing a two-legged bull cycle that culminated in Bar 1, the asset experienced a correction and technical compression phase against the psychological and structural barrier of $101. Driven by price action and institutional order flow, the token debates its persistence in a counter-trend bull channel as buyers attempt to cement a definitive breakout toward $119.
Market Dynamics and Candlestick Psychology
The pulse between resistance and dynamic support
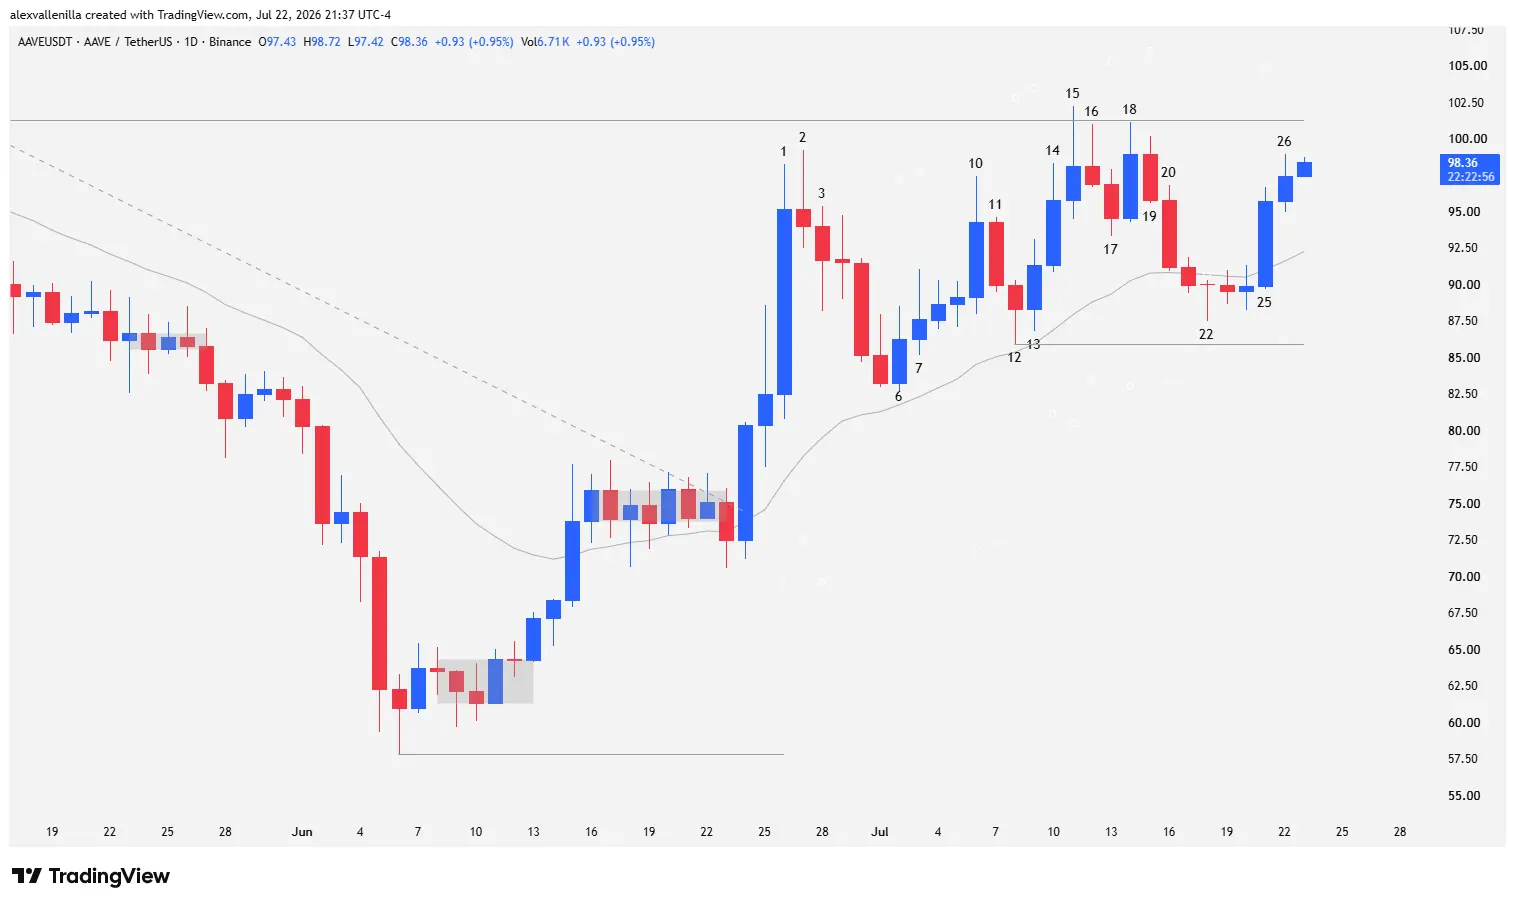
The price structure displays how smart money and sellers defend critical zones on the chart. Following the initial push from Bar 1, which printed a clear climatic acceleration bar without touching $101, the market triggered a corrective pullback. This bearish move found the brakes at Bar 6 above the 20-period Exponential Moving Average (EMA), respecting higher lows that sustain the development of a temporary ascending channel.
As the price advanced toward the upper zone, Bar 10 tried to accelerate with a wide range, but left a significant upper wick. This highlights high effort with a small result, demonstrating that sellers continue defending the main resistance.
The rejection at the $101 zone and the deceleration pattern
Buyers sought to break the resistance repeatedly. At Bar 15, the price managed to pierce the barrier temporarily, but closed below it, generating a pin bar that trapped late buyers. A similar attempt at Bar 18 failed once again, fulfilling the trading maxim that when a target fails twice, the opposite usually happens.
The subsequent drop found a key floor at Bar 22, a doji with an extensive lower wick whose body and deceleration exposed seller exhaustion. Finally, institutional inflow at Bar 25 broke the congestion to the upside, defending the local support located at $86.
Technical Analysis
The exhaustive analysis of price action details the following sequence on the AAVE daily chart:
Bars 1 to 5: Bar 1 prints a high-conviction bullish candle completing a two-legged move, whose high misses the $101 resistance. Bar 2 and Bar 3 initiate a bearish pullback that decelerates before touching the 20-period EMA.
Bars 6 to 12: Bar 6 generates a bullish outside bar halting the drop above the 20 EMA. Following compression at Bar 10, Bar 12 marks a local support at $86 with a clear lower rejection wick.
Bars 15 to 21: Bar 15 and Bar 18 fail consecutively to consolidate the $101 breakout, forming a double-failure pattern that drives a correction down to Bar 21, which briefly punctures the 20 EMA.
Bars 22 to 26: Bar 22 displays marked selling weakness via a deceleration doji. Bars 25 and 26 confirm institutional capital inflow defending the $86 support, pushing the price back toward the resistance zone without the upper rejection wicks observed in previous attempts.
The technical battle around $101 defines the medium-term bias for AAVE. If bulls manage to digest accumulated liquidity and consolidate a breakout above this barrier, the path remains open toward the $119 target, building a solid trend reversal structure. Otherwise, the dynamic support of the 20 EMA at $92 and the $86 floor act as indispensable safety nets to keep the current bullish bias alive.
Disclaimer: This article is for educational and informational purposes only. It does not constitute financial advice or an investment recommendation. Crypto trading carries high levels of risk; always trade at your own risk.

Communications Professional. Crypto Enthusiast. Economic Journalist. Bitcoiner & Altcoiner.


