

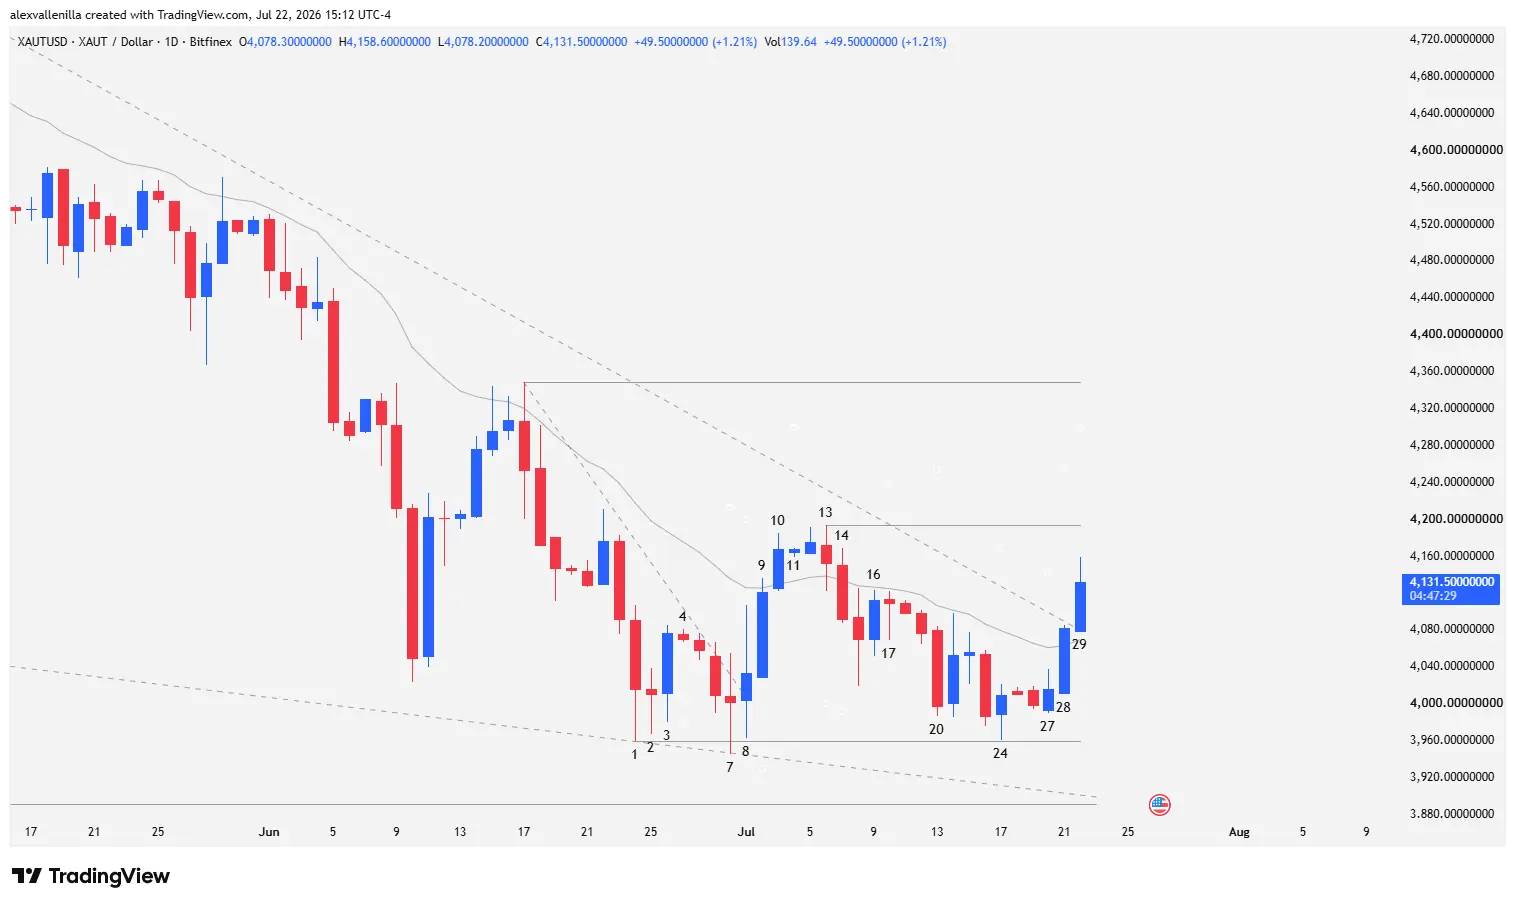
Buyers have formally seized control of the price action in Tether Gold (XAUT) on the daily timeframe (1D). After compressing lows against key support at $3,960 and shaping an exhaustion pattern in the form of a falling wedge, institutional order flow pushed the price above the 20-period exponential moving average (20 EMA) and the main downtrend line. The current move aims to validate a structural breakout above $4,193 to trigger a bias shift toward $4,348.
The Turning Point: Seller Exhaustion and Double/Triple Bottom
The dominant narrative in XAUT had remained under seller control since the resistance zone at $4,348. However, the supply’s inability to print closes below $3,960 signaled a clear loss of downside momentum.
The three downward pushes projected toward the lower boundary of the channel reflected the slowing bearish order flow. The lack of continuation after piercing key levels acted as the catalyst for demand to absorb circulating supply, setting the stage for a bear trap.
Technical Analysis of Price Action (1D)
Bar-by-bar chart analysis clearly reveals the psychological transition of the market:
Bars 1 to 4 (Initial Floor and Micro Channel): Bar 1 marks the low at $3,960, completing a two-leg bearish micro channel from $4,348 with a prominent lower tail. Bar 2 (inside bar) and Bar 3 (a reversal that fails to top B1’s high) show a weak bounce. Bar 4 consolidates in a tight range, respecting resistance from the 14-bar mini channel.
Bars 7 to 9 (Bear Trap and Confirmation): After three acceleration candles, Bar 7 prints a doji that slightly pierces $3,960 support and tests the base of the larger falling wedge, but fails to close below it. Bar 8 reacts violently in the opposite direction, invalidating B7’s breakout and trapping late shorts. Bar 9 breaks out as a high-conviction candle (bullish marubozu with a minimal upper tail), breaking the mini channel and clearing the 20 EMA.
Bars 10 to 17 (Resistance at $4,193 and Bearish Failure): Following deceleration in B10 and B11, sellers attempt to regain control in Bar 13 with a high-volatility outside bar that sets a lower high at $4,193. Bar 14 breaks down below the 20 EMA. However, the bullish resumption attempt in Bar 16 leads to Bar 17 (an inside bar) that offers no continuation; this failed reversal pulls in short-term selling volume.
Bars 20 to 24 (Sell-off Climax and Final Absorption): Bar 20 unleashes a climactic acceleration downward, completing a two-leg move from B13. Despite its volume and size, its low fails to test $3,960, leaving an exhaustion gap. Bar 21 traps breakout sellers. In Bar 24, supply tries to break $3,960 support once more, but demand heavily absorbs the flow, closing with a prominent lower wick and confirming the second consecutive bearish failure at this level.
Bars 27 to 29 (Explosive Breakout and Current Context): Bar 27 snaps the sequence with a bullish close. In Bar 28, institutional flow drives prices up aggressively (shaved bottom with no lower wick), crossing the 20 EMA and convincingly validating a triple bottom structure above $3,960. Bar 29 (in progress at the time of writing) keeps up buying pressure, opening without a lower wick and cleanly piercing the 144-bar downtrend line and the top of the falling wedge.
Outlook and Trading Scenarios
Price is trading comfortably above $4,100. At the time of this writing, Bar 29 is attempting to test key resistance at $4,193.
If Smart Money manages to consolidate a daily close above $4,193, price action will head straight for $4,348. A definitive breach of this last level would confirm the breakout of the intermediate bearish structure, opening up space for an extended bullish phase.
Conversely, if resistance at $4,193 rejects the current candle, XAUT will seek support at the 20 EMA ($4,069). Losing this dynamic moving average would reopen the risk of retesting the structural floor at $3,960.
The failure of the selling pressure around $3,960 and the clean breakout of the falling wedge on Bar 29 mark a major technical pivot for XAUT. The market has shifted from a compression phase into a bullish expansion phase, where clearing $4,193 will dictate the strength of this new cycle.
Disclaimer: This article is strictly for informational and educational purposes. The price action analysis of digital assets presented here does not constitute a direct investment recommendation or financial advice. Traders must manage their own risk before executing trades in the market.

Communications Professional. Crypto Enthusiast. Economic Journalist. Bitcoiner & Altcoiner.


