In a session marked by global caution, Tether Gold (XAUT) is undergoing a significant correction. Currently trading at $4,592—a daily drop of 2.04%—the asset, which tracks the value of an ounce of physical gold on the blockchain, appears to have exhausted its short-term bullish momentum. A combination of a deteriorating market structure and uncertainty in the Strait of Hormuz, where the White House continues to view Tehran’s nuclear proposals with skepticism, triggered technical sell signals that institutional traders are monitoring closely.
Geopolitics: Crude Rises, Safe Havens Weaken
Despite the current truce between the United States and Iran, tension hasn’t vanished; it has merely transformed. The mutual blockade in the Strait of Hormuz reduced tanker traffic to minimum levels, pushing crude oil back above $100. Paradoxically, as rising energy costs stoke inflationary fears, XAUT is showing weakness.
The White House’s dissatisfaction with the Iranian nuclear program suggests the underlying conflict persists. However, the immediate easing of hostilities has, for now, stripped away the “risk premium” that supported the digital precious metal at higher levels.
Technical Analysis: The “Three Pushes” Structure and Sell Trigger
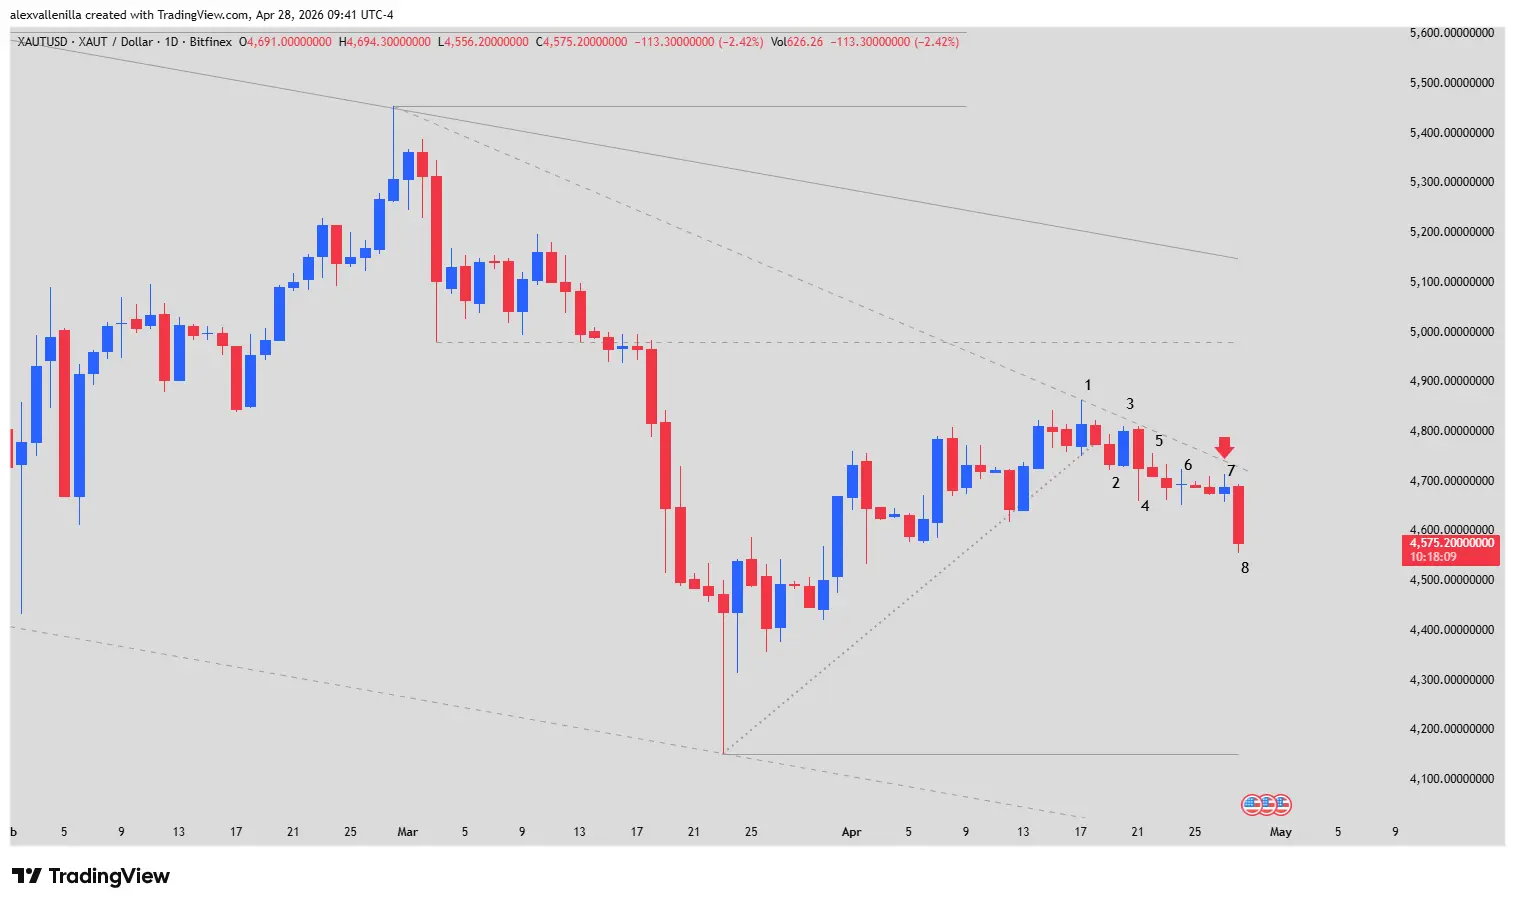
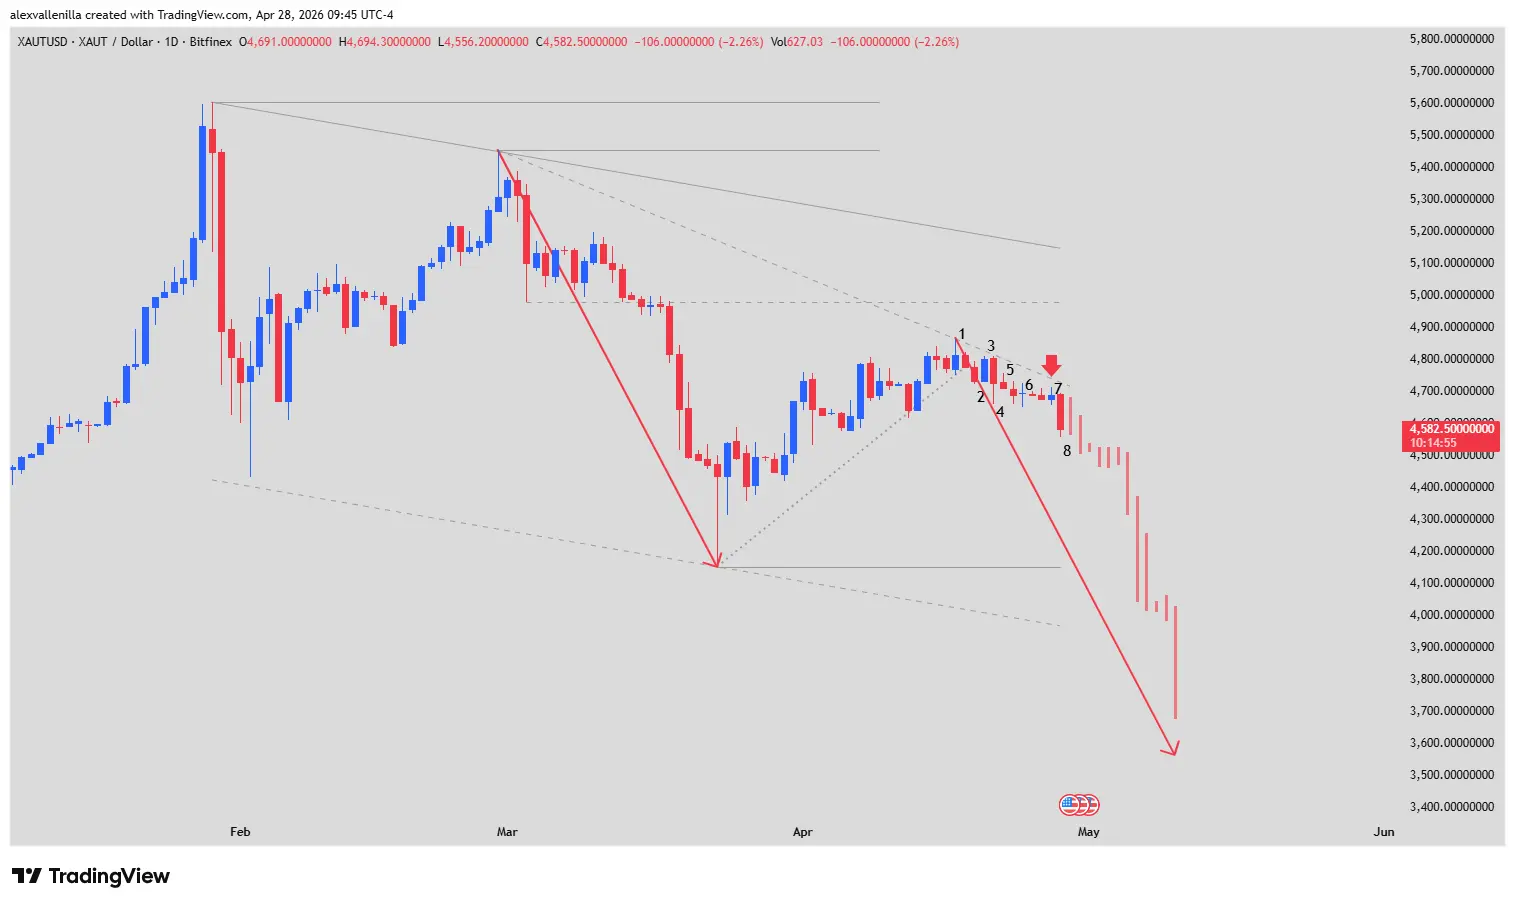
The daily time frame (1D) chart presents a textbook bearish narrative. Following a major cycle of 918 bullish bars, the asset is now in an 89-bar counter-trend corrective phase, moving with surgical precision below a 60-bar resistance line.
Price Action Breakdown by Bars:
Bar 1: Marked the climax of a 26-bar bullish microchannel. Here, price formed the third push of an exhaustion pattern, compressing into a rising wedge after bouncing from support at $4,150. The inability to test resistance at $4,980 was the first sign of fatigue.
Bars 2 and 3: Bar 2 formally broke the microchannel, while Bar 3 represented a bullish “breakout failure,” remaining below the previous high and showing overlap, confirming that demand lacked conviction.
Bars 4 to 6: A power transition occurred. Bar 6 set up a Doji with a second lower low, establishing a Low 2 sell setup. Although the signal did not trigger immediately, the market began to “box in” within a distribution zone.
Bar 7: Acted as the definitive catalyst. A small outside bar with a bullish close, but with a lower high compared to bars 1, 3, 5, and 6. This weakness at the top of the trendline suggested a high statistical probability of a reversal.
Bar 8 (Current): This is the confirmation bar. By breaking the low of Bar 7, the sell signal officially triggered. With a prominent bearish body, the price now has a clear path to seek the technical target in the $4,150 support zone.
Long-Term Outlook: Heading Toward $3,700?
If the $4,150 support fails to hold the selling pressure, XAUT could enter a deeper capitulation phase. Technical projections suggest a two-legged bearish move under a staircase pattern. If this projection plays out, the final target would sit at $3,700 by late May 2026, completing the full correction from the $5,450 all-time high.
The market spoke: the complacency of bulls following the bounce from key supports has been punished by a flawless technical structure. XAUT now faces a trial by fire where macroeconomics and charts appear to align toward a deeper correction.
Disclaimer: This analysis is strictly for informational purposes and does not constitute financial advice or investment recommendations. Digital asset trading carries a high risk of capital loss.
Communications Professional. Crypto Enthusiast. Economic Journalist. Bitcoiner & Altcoiner.