

The Ethereum (ETH) market maintains short-term technical recovery momentum that continues to capture institutional traders’ attention. After validating a solid double bottom on $1,537 support, the asset triggered a two-leg impulsive move that challenges the dominant long-term downtrend. However, recent daily chart price action shows progressive exhaustion in buying flow, marked by a loss of momentum near the $2,006 structural resistance.
Bear Trap and Institutional Push: Buyers’ Initial Dominance
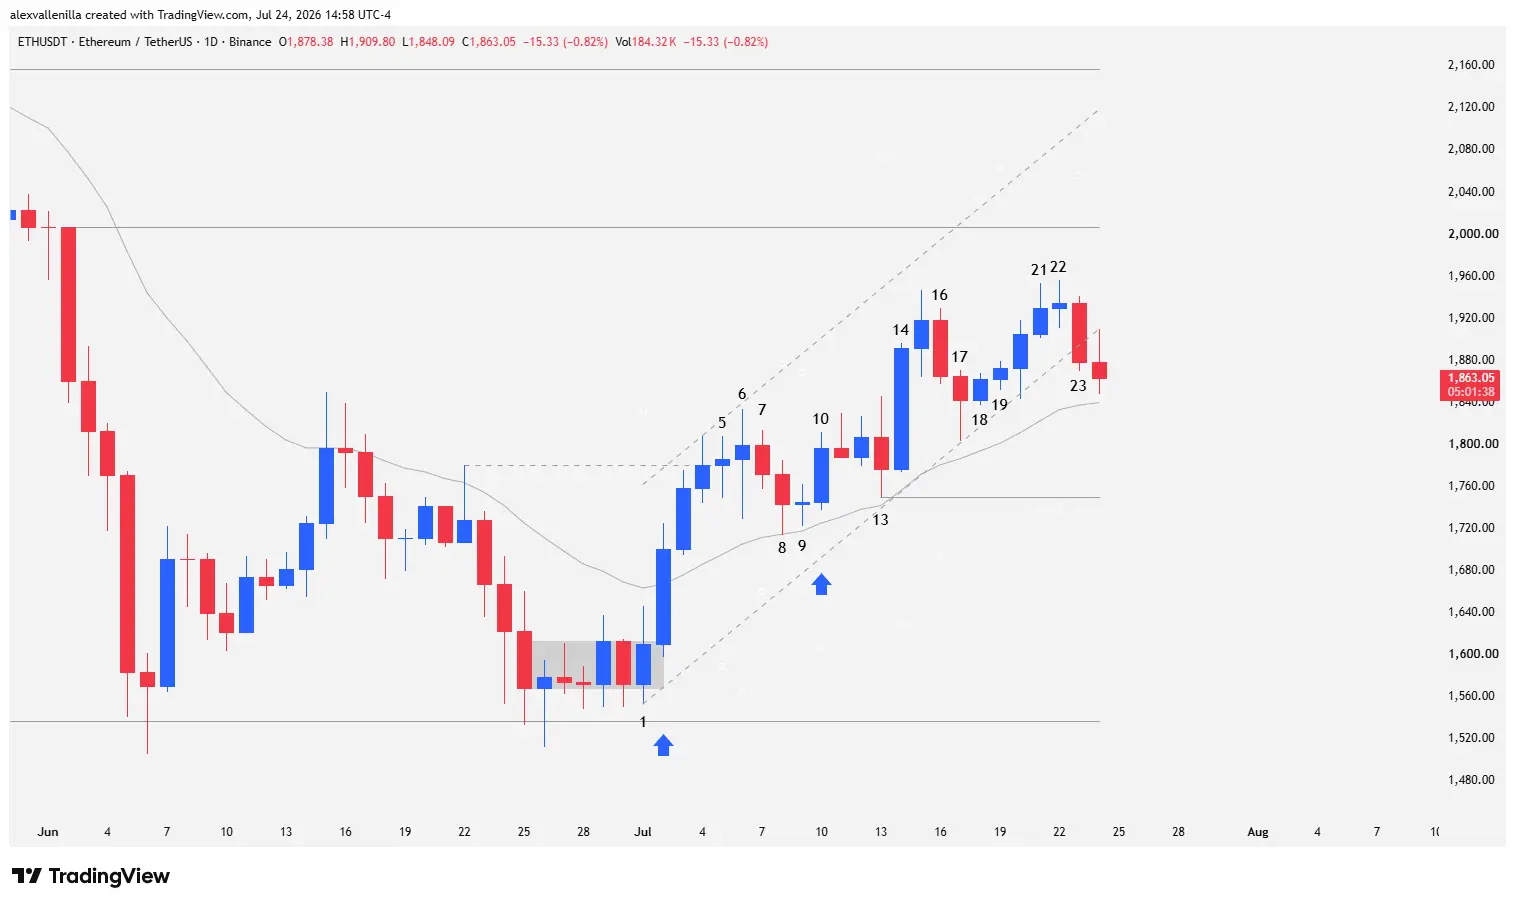
The current bullish narrative gained technical strength from the structural failure observed between Bar 4 and Bar 5. The chart confirmed an upside breakout above $1,779, a level acting as the right shoulder of a bearish Head and Shoulders pattern. The immediate invalidation of this pattern triggered a massive buy signal driven by supply absorption.
Subsequently, Bar 6 introduced volatility with a doji that led to a minor two-bar pullback (Bar 7 and Bar 8). Bar 8 tested the 20-period Exponential Moving Average (20 EMA) without closing below it, establishing a higher low relative to the Bar 1 low.
Bar 9 acted as an inside consolidation bar over the 20 EMA, setting the stage for Bar 10, which confirmed a high-probability buy setup (High 2). This move trapped Bar 8 sellers and triggered buy-stop orders on Bar 11 as price cleared the previous high.
True institutional capital deployment showed up on Bar 14, following a failed pullback attempt on Bar 13 that printed a higher low relative to bars 1 and 8. Bar 14 printed a wide-range bar with a 6.48% expansion, closing with virtually no upper or lower wicks. This footprint shows absolute demand-side order flow dominance right from the open, decisively clearing the highs of bars 6 and 13 within a 23-bar bullish mini channel that originated at $1,537 support.
Multiple Compressions and Demand Exhaustion
Despite the strength of Bar 14, the continuation on Bar 15 exposed initial signs of weakness: a tight range with wicks at both ends that failed to reach the upper channel line. Bars 16 and 17 executed a pullback where Bar 17 formed a hammer that respected the 20 EMA, anchoring the bottom trendline of the mini channel.
Subsequent price action reflected a clear loss of impulsive power:
Bar 18 and Bar 19: Bar 18 served as a small-range inside bar that halted selling, while Bar 19 confirmed a pullback failure by breaking above the Bar 17 high, albeit with noticeably smaller range, indicating lack of follow-through.
Bar 20: Marginally pierced the lower channel boundary as an outside bar, but managed to close above the Bar 19 body.
Bar 21: Printed an upper wick after briefly pushing above the Bar 15 high, failing to close above this level and stalling well short of $2,006 structural resistance. The structure formed a rising wedge from the Bar 16 high.
Bar 22: Remained contained within the Bar 21 range as a body-less doji, marking the third push of the channel alongside severe momentum loss.
Bar 23 and Bar 24: Bears reacted with a strong breakout on Bar 23, piercing the base of the mini channel and the lows of the previous two bars. Bar 24 (developing bar) trades at $1,860, confirming the channel breakdown with a small body that sets up a developing two-bar pullback.
Structural Scenarios: Trend Reversal or Another Market Trap?
The current technical context places Ethereum at a critical inflection point. On one hand, visible accumulation in impulsive bars like Bar 2 and Bar 14 supports active institutional buying in the lower zone. Additionally, Bar 24 trading at $1,860 holds above the 20 EMA, keeping the series of higher lows intact.
Price Action Perspective: To build a sustainable medium-term trend reversal, demand must absorb current selling and decisively break $2,006 resistance, opening the path toward the major target at $2,160.
Conversely, if buyers fail to reignite momentum off the 20 EMA, the structure risks turning into a bull trap within the broader downtrend. Under this bearish scenario, the key level to watch is the Bar 13 low at $1,750, a pivot serving as the structural control point for the current move.
The mini channel breakdown on Bar 23 warrants caution for market participants. Even if smart money defends levels above the 20 EMA and $1,750 support, Ethereum needs to clear the critical $2,160 barrier to redefine its technical structure and validate a larger-scale bull cycle.
Disclaimer: This analysis is strictly for informational and educational purposes regarding price action and does not constitute financial advice or investment recommendations. Cryptocurrency markets carry high volatility; conduct your own research before making trading decisions.

Communications Professional. Crypto Enthusiast. Economic Journalist. Bitcoiner & Altcoiner.


