

The decentralized finance (DeFi) market is closely monitoring recent price action dynamics in Uniswap (UNI). On the daily timeframe (1D), the pair seeks to confirm a structural shift after posting a 31.18% gain over the past month, attempting to counter an underlying downtrend that has accumulated a -62.30% drop over the last 12 months. The current narrative reflects a fierce institutional battle between supply and demand, where buyers fight to maintain control above the 20-period exponential moving average (20 EMA).
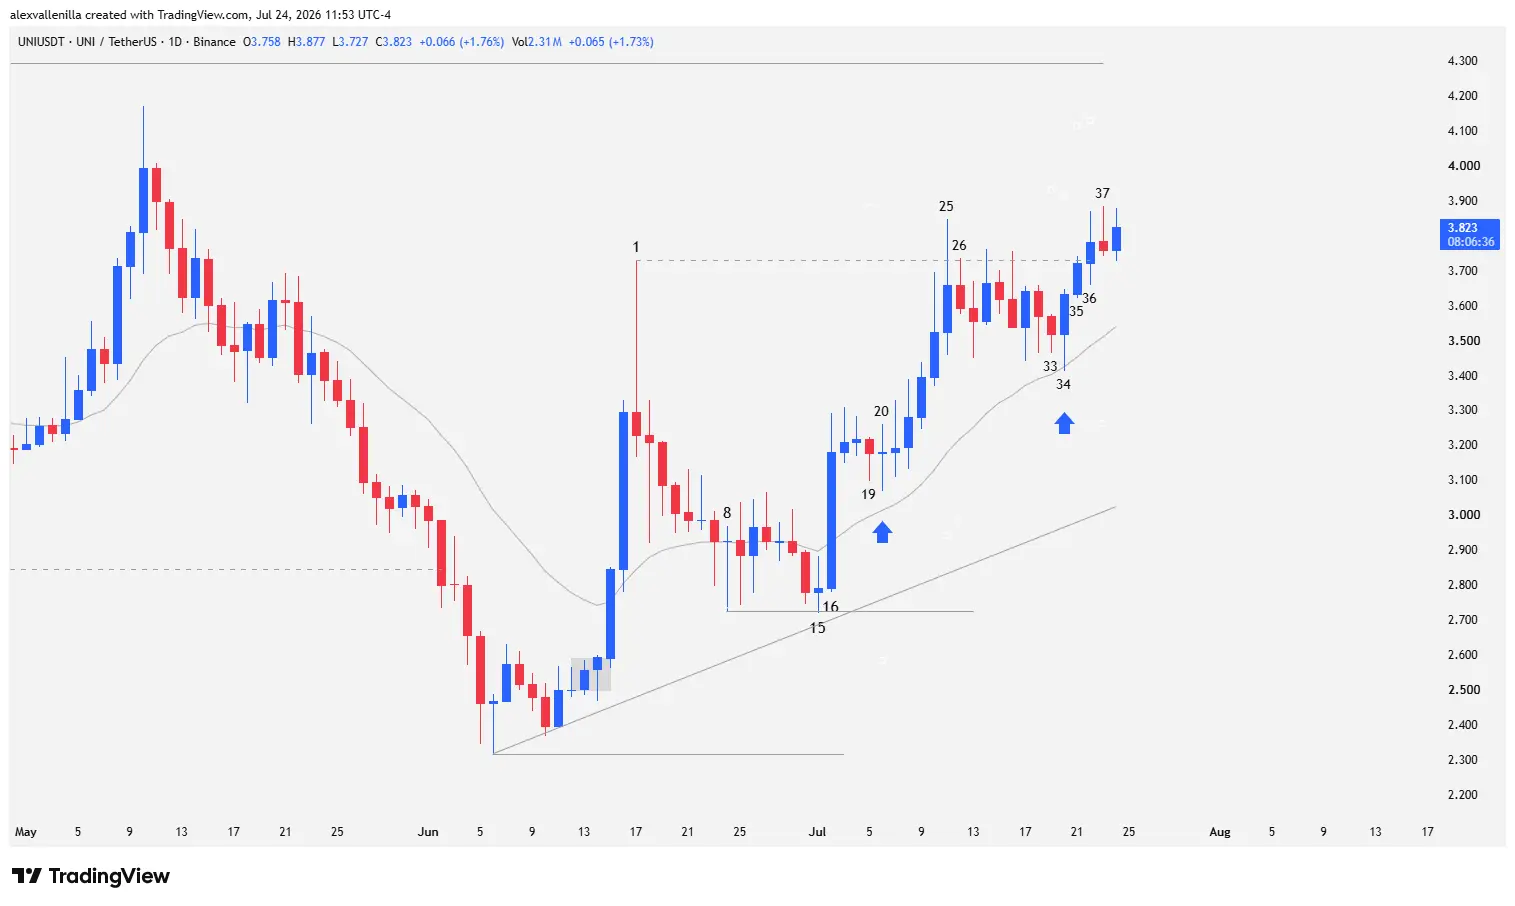
Market Structure and Context: A Two-Legged Bounce in Progress
UNI’s recent price action shows the formation of a short-term bullish microchannel spanning the last 48 bars. However, on the macro timeframe, this move qualifies as a counter-trend bounce within a primary downtrend that remains intact.
The current bullish momentum aims to project a measured two-legged move. The institutional order flow’s primary target sits at the $4.29 resistance zone, a confluence point with the high of a previous bull trap that attempted to resume the larger downtrend. Because the prior low accurately respected support at $2.00, the ongoing bounce retains the technical momentum to invalidate that trap.
If bulls manage to test and consolidate price above $4.29, UNI will begin laying the foundation for a new medium-to-long-term structure.
If demand fails to break that threshold, the market risks setting up a second bull trap, forcing traders to monitor support at the 20 EMA ($3.54) and the dynamic ascending trendline ($3.02).
Technical Price Action Analysis: Bar-by-Bar Narrative
Bars 19 to 21: Pullback Failure and Institutional Buy Activation
Sellers attempt a corrective move at Bar 19, but because it presents an extremely narrow range within an emerging bullish microchannel, supply executes a weak counter-trend entry. Bar 20 breaks the high of Bar 19, confirming the pullback failure; as an outside bar, this candlestick acts as a clear continuation signal for the massive buying seen at Bar 16 by institutional money.
Both Bar 19 and Bar 20 trade solidly above the 20 EMA. Subsequently, Bar 21 consolidates as a doji that breaks above the previous high, pushing price through a sequence of four bullish bars. This rally shows overlap and upper wicks, indicating that supply aggressively defends the Bar 1 resistance at $3.72.
Bars 25 to 33: Bar 1 Resistance and Micro-Range Congestion
Bar 25 attempts to complete the second leg up by breaching the $3.72 high (Bar 1). However, buyers fail to close above this level, and the candle leaves a prominent upper wick, reflecting clear bearish defense. Bar 26 emerges as an inside bar lacking bullish follow-through, leading into Bar 27, where bears break the previous low and confirm the correction.
Despite this push, Bar 28 executes a rapid reversal that cuts off the momentum of the two-bar pullback. The bulls’ inability to overcome resistance triggers congestion in the form of a micro-range through Bar 33. The latter is an inside bar whose low tests near the 20 EMA without breaching it. The lack of depth in this pullback demonstrates the sellers’ inability to take control of the trend, shifting momentum into a lateral consolidation over dynamic support.
Bars 34 to 38: Third Bearish Failure and Ongoing Breakout
Bar 34 reacts off the 20 EMA as a powerful bullish outside bar that breaks the high of Bar 33, marking supply’s third consecutive failure to validate a deep pullback. At Bar 35, buyers extend the move by closing above Bar 24, confirming the buy signal.
Bar 36 manages to close above the key $3.72 resistance level (Bar 1); however, wicks on both ends reveal that the breakout lacks absolute dominance. In response, Bar 37 launches a bearish counterattack forming an inverted hammer, but fails to re-enter below the $3.72 level, which now acts as flipped support.
At Bar 38 (developing candle), buyers attempt to negate Bar 37’s pull-back wick to consolidate the bullish bias and push toward the major resistance target at $4.29.
Uniswap’s price action shows significant supply absorption around the key $3.72 level. The buyers’ ability to generate recurring pullback failures above the 20 EMA reflects strong buying liquidity in lower timeframes. Market session dynamics will keep two main outcomes in play: confirming the second leg up or risking a broad range consolidation.
Disclaimer: This article is strictly for informational and educational purposes regarding financial market technical analysis. It does not constitute investment advice, financial guidance, or an invitation to trade digital assets under any circumstances.

Communications Professional. Crypto Enthusiast. Economic Journalist. Bitcoiner & Altcoiner.


