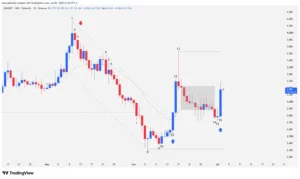
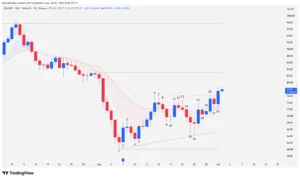
A deep technical analysis of the UNI/USDT pair on its daily (1D) chart reveals a crucial battle between supply and demand. Despite carrying a severe long-term primary downtrend, smart money has begun validating a solid support zone. The rejection of new lows and the appearance of high-conviction bullish bars suggest that the governance token of the largest decentralized exchange is in a strategic accumulation phase, defying the market’s selling inertia.
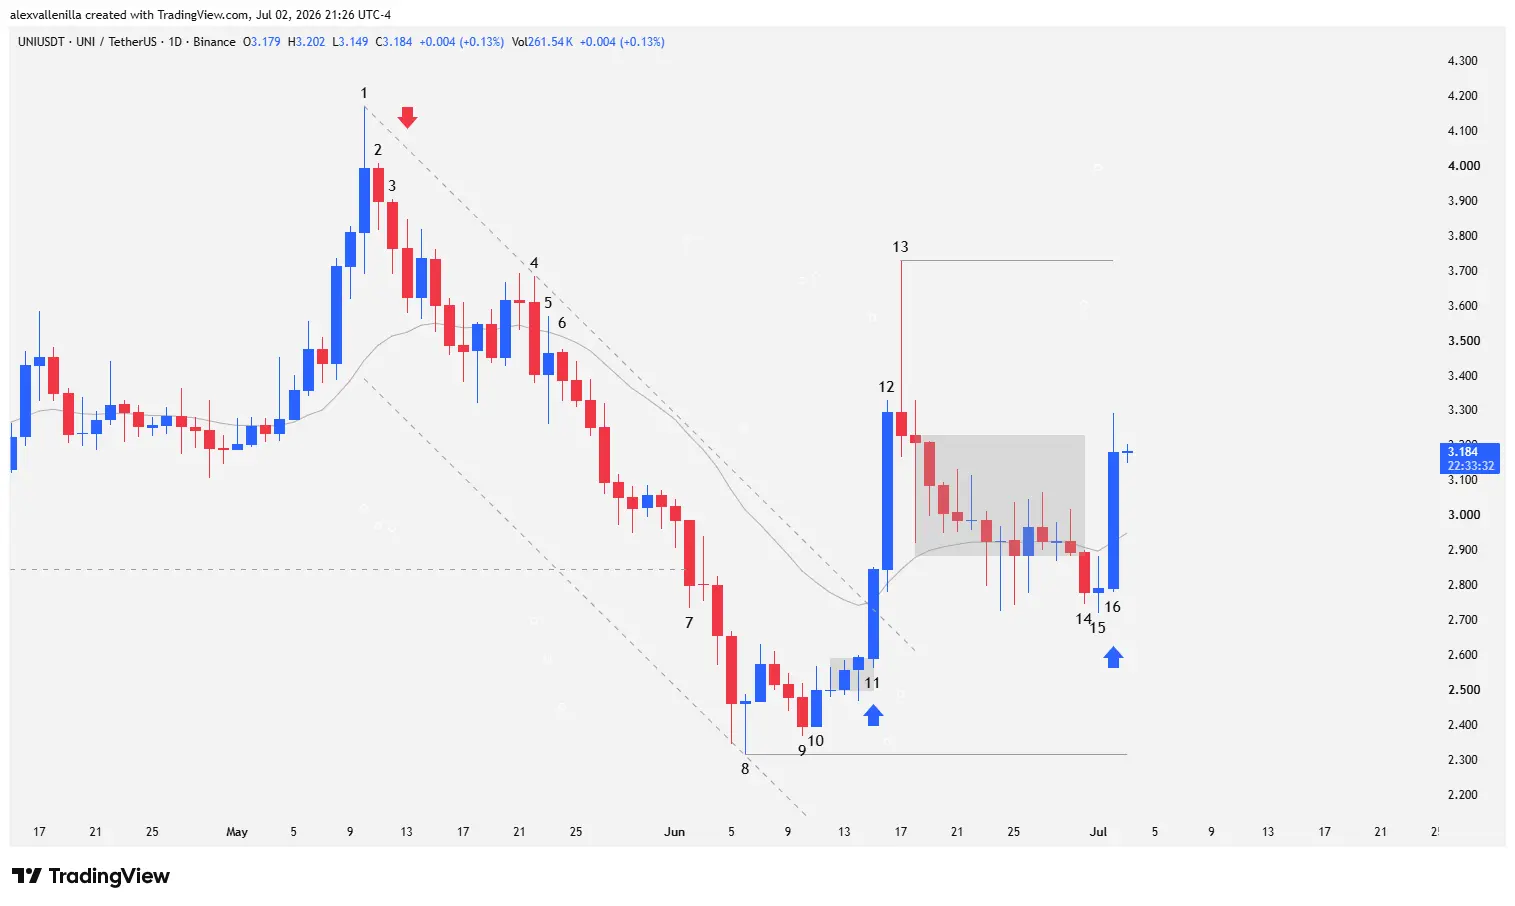
Chart Anatomy: The Journey from Trap to Capitulation
Uniswap’s recent price structure shows how institutional dynamics trap retail traders before defining a clear direction. It all started with a failed attempt to reverse the macro trend, which served as the catalyst for an aggressive sell-off.
Bar 1 to Bar 4: The Failed Rally and Short Activation
Buyers initially attempted to test key resistance at $4.58 at Bar 1. However, price action printed an EMA gap bar (a bar that opens and closes completely separated from the 20-period exponential moving average), a classic sign of bullish exhaustion under the “sell the rally” premise. Bar 2, an inside bar with a bearish close, confirmed the bull trap.
Confirmation of the pullback came with Bar 3, which pierced the previous low and dragged the price to intertwine with the 20 EMA. Immediately after, the market set up a Low 2 short entry pattern; the breakout of its low activated short-sell orders. Finally, Bar 4 closed below the 20 EMA, using its high as the definitive anchor to map the upper boundary of a secondary descending channel.
Bar 5 to Bar 7: Support Break and Bearish Capitulation
Recovery efforts at Bar 5 failed, giving way to an inside consolidation Bar 6. The following session confirmed this defensive failure, attracting more sellers to the market.
The pressure culminated in Bar 7, a purely bearish candle that accelerated the drop and destroyed key support at $2.84. This level was vital, as it represented the base of a 116-bar trading range with a ceiling at $4.58. After breaking this floor, the market printed three consecutive bearish candles with increasingly larger bodies. However, the lower tails of these bars betrayed a massive absorption of supply—an unequivocal sign of capitulation after a two-legged down move.
Technical Analysis: Smart Money Takes Control at the Bottom
This section details the market’s narrative shift based on a rigorous analysis of order flow in the chart’s recent daily bars.
Bar 8 to Bar 10: Loss of Momentum and Floor Defense
Bar 8 stopped the bleeding dead in its tracks. This pinbar recorded a close that denied bearish continuity, establishing a new low at $2.31. What is truly relevant for the technical analysis is that the bears failed to test macro support at $2.00 (a level defended for 266 bars that represents the absolute low of the primary trend). By failing to reach this target, sellers exhibited a clear loss of momentum, allowing buyers to protect the new floor at $2.31.
Following a bullish fakeout, Bar 9 failed to retest that support, and Bar 10 trapped late sellers, keeping the price safe and initiating a brief congestion phase.
Bar 11 and Bar 12: Institutional Breakout with High Conviction
Institutional strength manifested clearly at Bar 11. This high-conviction bullish candle simultaneously broke the congestion pattern and the upper line of the 39-bar secondary descending channel. By achieving a close above the 20 EMA, the market validated the support at Bar 8, issuing a powerful buy signal for counter-trend traders.
Volatility expanded at Bar 12, where smart money aggressively attacked with another wide-range candle, maintaining momentum and consolidating the moving average breakout.
Bar 13 to Bar 16: Absorption, “Barbed Wire,” and Bullish Resolution
Despite the optimism, Bar 13 halted the direct advance. It ended as a bearish pinbar with a massive upper tail that betrayed demand absorption by late sellers in the macro trend. Its high set a minor resistance at $3.72, setting up another EMA gap bar.
From there, the price entered a 11-session tight congestion pattern known as barbed wire, intertwining with the 20 EMA in a flat range that denotes accumulation. Bears attempted to break lower at Bar 14 with a tiny body and no volume, followed by a doji at Bar 15 reflecting total indecision and a failed bearish breakout. Finally, Bar 16 resolved the dilemma: a firm conviction bullish candle where institutional capital re-entered at higher prices, positioning the close solidly above the 20 EMA.
The Price Action Verdict
Uniswap technically remains within a macro bearish structure, but the rules of the game are changing at the bottom of the chart. Recent bullish bars show a much wider range and clear institutional intent compared to the weakening candles of the sellers. To declare a definitive medium- or long-term trend reversal, bitcoin’s decentralized counterpart UNI must forcefully break resistance at $3.72 (Bar 13 high) and, crucially, the critical zone at $4.58. Meanwhile, support at $2.31 stands as the line in the sand that bulls must defend to keep this promising accumulation phase alive.
Disclaimer: This analysis is for purely informational and educational purposes based on price action and does not constitute financial advice or an investment recommendation. Cryptocurrencies are highly volatile assets; conduct your own research before risking your capital.
Communications Professional. Crypto Enthusiast. Economic Journalist. Bitcoiner & Altcoiner.