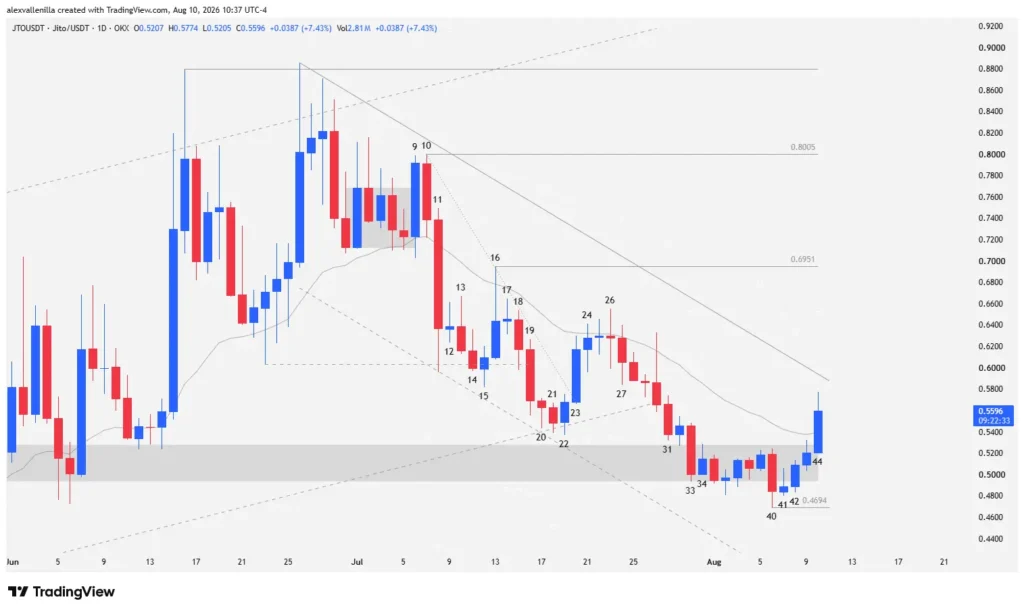
Jito (JTO) price navigates a crucial corrective phase on its daily chart (1D) after breaking its previous 114-bar bullish structure. Facing selling pressure that diminished conviction, price action analysis uncovers a tactical battle between bulls and bears at critical support zones of $0.4694, evaluating order flow strength in real time.
Market Dynamics and Current Structure
The cryptocurrency market demands millimeter-level reading beyond lagging indicators. The loss of the main 114-bar uptrend forced the Solana protocol’s native token to build a secondary 46-bar bearish channel, where each relative high and lower low reflects the psychological tug-of-war between institutional supply and retail demand.
Technical Analysis: Bar Reading and Order Flow
Price behavior in the 1D timeframe exposes the following critical phases in price action:
Rebound Attempt and Bearish Micro-Region (Bars 16 to 20): Bar 16 prints a long upper wick unable to surpass the 20-period exponential moving average (EMA 20), validating a lower high relative to bar 10 and triggering the micro-bearish channel trendline. Following the indecision of bar 17 (internal doji), bar 18 and bar 19 break local support at $0.6035. However, bar 20—a small-range pin bar—halts bearish continuity by failing to close below bar 19, testing the 114-bar macro bullish guideline.
Failed Reversal and Volatility (Bars 21 to 26): Although bar 21 slightly pierces the main 114-bar trendline, bear weakness fosters a bullish outside bar at bar 22, which traps previous sellers. Bar 23 breaks the micro-bearish channel but hits the EMA 20 dynamic resistance. The subsequent bar 26, a high-volatility outside candle, prints a new lower high compared to bar 16, consolidating a secondary 46-bar bearish channel.
Capitulation and Support Defense (Bars 31 to 44): Following a bearish trickle with narrow-range bars, bar 31 breaches the 114-bar uptrend line with shallow depth. Bar 33 acts as a climatic move or panic selling which, lacking continuity, finds a defensive floor at bar 40, setting a new local support at $0.4694 (backed by a previous micro range whose lower limit sits at $0.4941). Finally, bar 44 shows bulls reclaiming the EMA 20 and validating the congestion zone as support, awaiting a challenge against the dynamic bearish resistance.
Volume compression during JTO‘s technical correction demonstrates clear fatigue in selling pressure. While the short-term bearish structure remains active, the defense of critical support levels outlines a high-tension scenario where the invalidation of the bearish guideline will determine the return of bull control.
Disclaimer: This article is for educational and informational purposes only. It does not constitute financial or investment advice. Cryptocurrency trading carries high risks of loss; trade at your own risk.

Communications Professional. Crypto Enthusiast. Economic Journalist. Bitcoiner & Altcoiner.