

The cryptocurrency market is once again testing the resilience of bulls, with Jito (JTO) becoming the epicenter of a decisive technical battle. After breaking out of an accumulation range that halted the previous downtrend, JTO is consolidating a 101-bar ascending channel structure on its daily (1D) chart. The crypto asset posts an impressive performance with 101.93% gains over the last three months and a 67.71% year-to-date advance in 2026, managing to shake off a 65.15% year-over-year contraction. Order flow data reveals that institutional money—or “smart money”—maintains strategic dominance, using corrections to absorb retail supply.
Anatomy of the Price Action: Dynamic Bars and Market Traps
Initial Momentum and Demand Absorption (Bars 1 to 3)
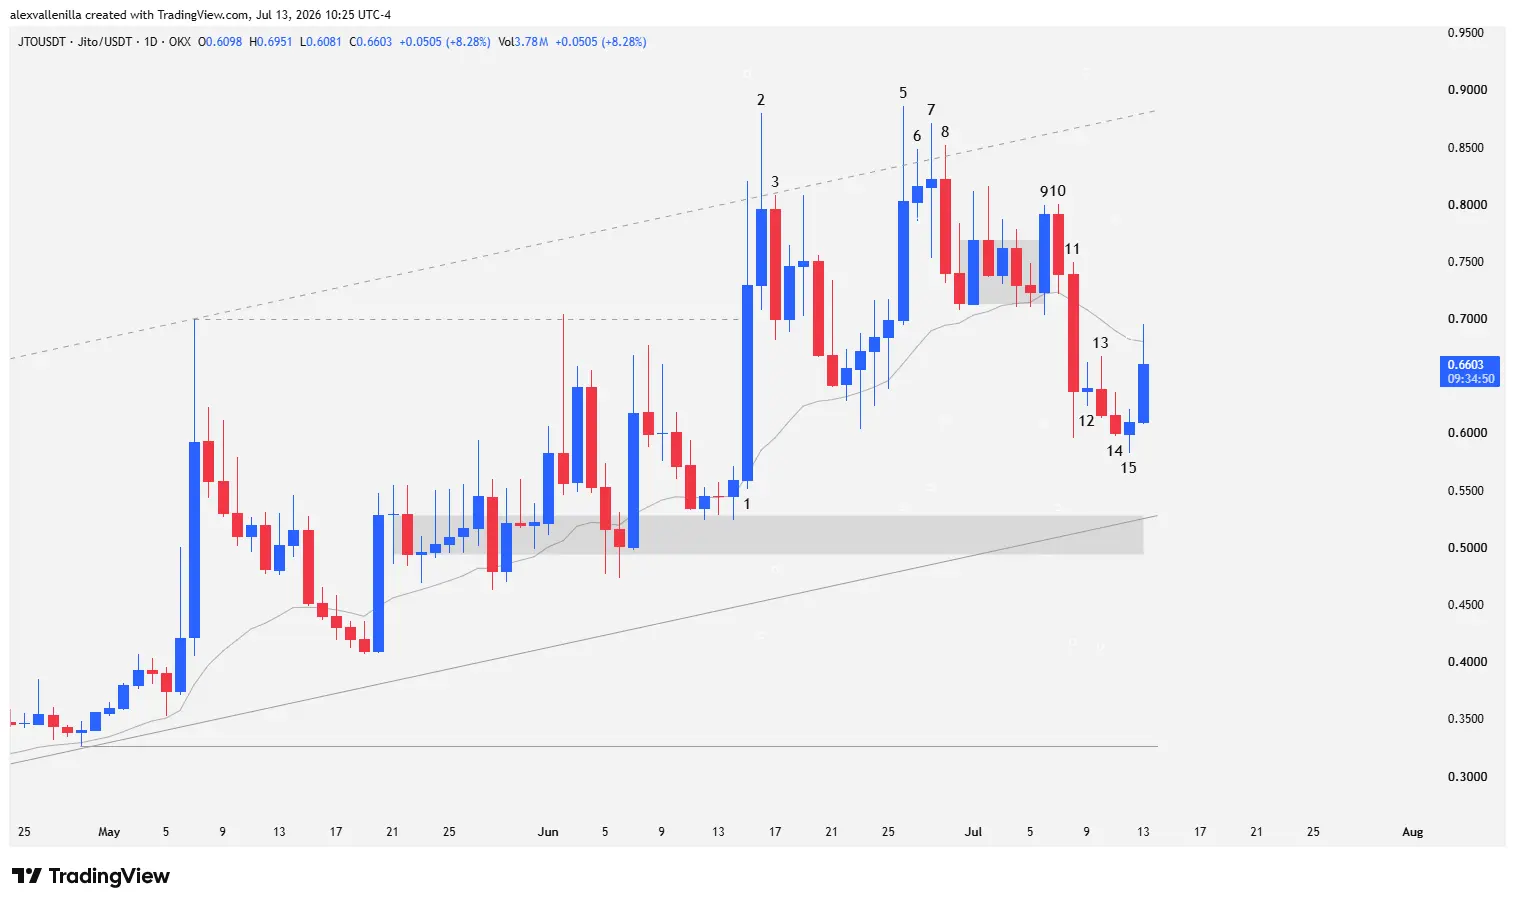
Bar 1 breaks through the key $0.7 resistance level with high conviction, a level that defined the previous range. Institutions enter with strength and slightly pierce the upper band of the dynamic channel, leaving an upper wick that betrays the first round of profit-taking. Bar 2 accelerates the move, clearing the channel top; however, bears absorb the demand and force a close with an upper tail larger than the body size. Confirmation of buyer exhaustion arrives with Bar 3, which breaks the minimum of the previous bar and initiates a healthy two-legged correction that respects the 20-period Exponential Moving Average (20 EMA).
Institutional Defense at the 20 EMA and the Double Top (Bars 4 to 7)
The pullback concludes at Bar 4, an outside pinbar or hammer candle with a prominent lower tail. Despite piercing the 20 EMA, buyers defend the zone and drag the price higher, followed by two supply-absorption candles. The new momentum culminates at Bar 5, where bulls fail for a second time to consolidate the price above the channel, printing a double top similar to the high of Bar 2. Bar 6 acts as an inside consolidation pause before Bar 7 (a wide-range outside doji candle) injects volatility. This bar exhibits massive wicks on both ends, showing a strong distribution zone and heavy sell orders at the highs.
Bull Traps and Bearish Capitulation (Bars 8 to 15)
Bar 8 liquidates lagging bulls by closing down and breaking the low of Bar 7. When the market fails twice at a target, the order flow rotates. After a period of congestion, Bar 9 executes a fake bullish breakout that Bar 10 immediately neutralizes, trapping late buyers. Capitulation arrives with Bar 11, where smart money sinks the price with a strong body that breaks the 20 EMA.
However, the flow changes: Bars 12, 13, and 14 show severe bearish exhaustion with decreasing ranges. Finally, Bar 15 prints a bullish-closing doji that traps short sellers at the bottom, bouncing cleanly before touching the channel support.
The Roadmap: Breakout Targets and Liquidation Zones
Structural technical analysis places JTO in a rebound phase after completing the healthy two-legged correction from the high of Bar 5. The volume and size of the high-conviction bullish bars at the lows far exceed the small retail pullback candles, shifting the probabilities toward a medium-term bullish resolution.
Bullish Scenario: Buyers face the challenge of crushing the dynamic resistance on the upper side of the channel at $0.88. Consolidating the breakout will open the door toward the second macro point of control of the previous downtrend at $1.17. Clearing this level would confirm a long-term structural shift.
Bearish Scenario: Critical support sits at $0.52 (the lower channel band and previous congestion zone). If the market violates this area, it will invalidate the 101-bar structure, risking a drop toward the first relevant low at $0.32.
Disclaimer: This analysis is exclusively informative and educational, based on current market price action. It does not constitute financial advice or an investment suggestion. Cryptocurrencies represent high operational risk assets.

Communications Professional. Crypto Enthusiast. Economic Journalist. Bitcoiner & Altcoiner.


