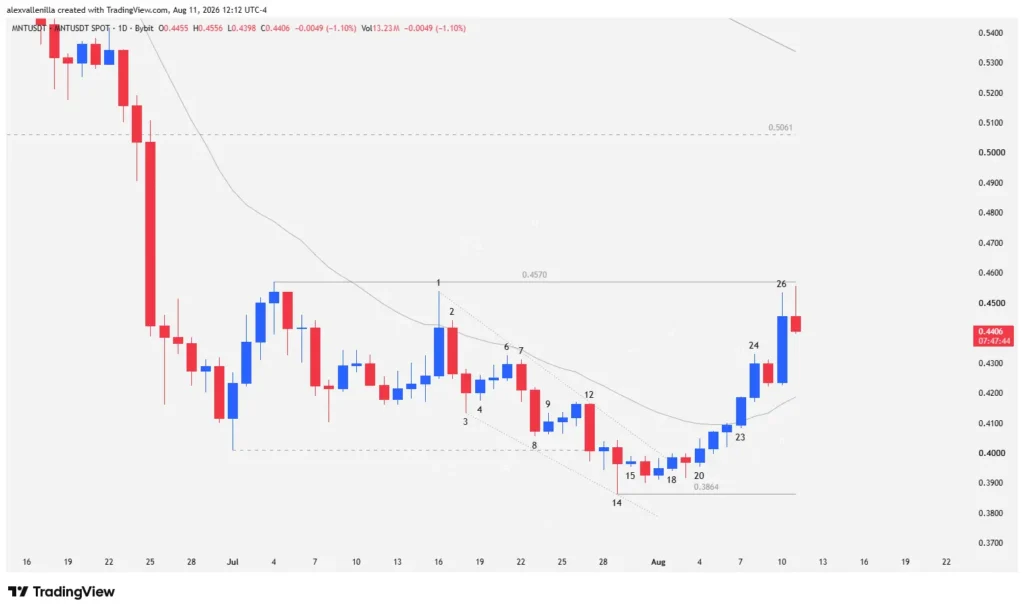
The native token of the Mantle network (MNT) is attempting to validate a shift in spot market dynamics. Buyers managed to break a 17-bar bearish structure and cross the 20-period exponential moving average (20 EMA), now facing a decisive test at the $0.4570 resistance. The move follows liquidity accumulation at the $0.3864 structural floor after exhausting selling pressure within a falling wedge pattern. This development opens the door for a retest of higher levels if institutional capital consolidates the breakout.
Macro Structure and Market Context
The asset remains embedded in a primary 147-bar downtrend originating from the structural high of $0.7015. The recent two-legged drop found exhaustion in the key support zone at $0.4011. From there, order flow began showing a transition characterized by the sustained failure of selling impulses and the appearance of absorption bars at the bottom of the range.
Price action shows a fierce battle between supply and demand around the 20 EMA. Although the higher-timeframe trend favors short positions, the loss of downside momentum allowed bulls to build a tight upward microchannel.
Detailed Technical Analysis: Bar-by-Bar Price Action Reading
A detailed study of order flow through candlestick psychology and bar-by-bar reading deciphers institutional behavior:
Phase 1: 20 EMA Piercing and Local Top Formation (Bars 1 to 3)
Bar 1: Bulls test the 20 EMA after 28 sessions without touching it—an unequivocal sign of the previous strong downside momentum. However, they fail to consolidate above it, merely piercing it. Bar 1’s high fails to test the local resistance at $0.4570, forming a double top with the previous high in that same zone. The long upper tail reveals sellers defending the level. This represents a breakout failure backed by high volume, suggesting a reversal.
Bar 2: A bearish body candle turns into an inside bar. Sellers aggressively reject the bullish attempt to push above the 20 EMA, keeping price contained below the moving average.
Bar 3: Bar 3 confirms the bearish pressure from Bar 2 but shows a loss of momentum by displaying a tiny body with a lower tail. It fails to approach the previous support at $0.4011.
Phase 2: Bearish Consolidation and Buyer Containment (Bars 4 to 9)
Bar 4: A new inside bar with a bullish body appears, temporarily halting the downward continuation.
Bar 6: Following a weak three-bar reversal, this very tight-range candle fails to even test the 20 EMA, exposing the lack of demand after the bounce started in Bar 4.
Bar 7: Bears resume the attack. Bar 7’s body completely overlaps the previous candle and validates the move by breaking below Bar 6’s low.
Bar 8: Provides confirmation of the pullback, though it stops short of testing structural support at $0.4011.
Bar 9: A bullish inside bar halts the selling pressure from Bar 8. Buyers react by attempting to defend $0.4011 through a reversal bar.
Phase 3: Bull Trap, False Breakout, and Wedge Floor Formation (Bars 12 to 15)
Bar 12: Smart money executes a violent pullback that traps buyers from Bar 11. The reversal from Bar 9 fails miserably. Bar 12’s high sets an anchor point for a 17-bar downward trendline, forming the top of a downward microchannel. Bar 12 slightly breaks support at $0.4011.
Bar 13: Lack of follow-through below Bar 12’s low. Bulls attempt a reversal with a tight range and tiny body. Bar 12 remains temporarily “naked.”
Bar 14: Bears seek to accelerate the sell-off but produce a hammer with a prominent lower tail and a very small body. By failing to close below Bar 13’s low, the acceleration is negated. The lower tail marks a new floor level at $0.3864. This low acts as the lower anchor for the downward microchannel, shaping a slight falling wedge. Bar 14 represents the failure of a failure.
Bar 15: A tiny bullish inside bar consolidates price action and halts the drop from Bar 14.
Phase 4: Channel Breakout, 20 EMA Cross, and Climax Bar (Bars 18 to 27)
Bar 18: Buyers manage to slightly break the top of the 17-bar downward microchannel.
Bar 20: Surpasses the failed pullback of Bar 19 after a compression period starting from Bar 15, confirming the microchannel breakout.
Bar 23: Bulls string together a solid push, taking out the highs of Bars 21 and 22. Bar 23 breaks above the 20 EMA, kicking off a tight upward microchannel.
Bar 24: Strongly confirms the 20 EMA breakout, closing comfortably above Bar 23’s high. It demonstrates clear institutional participation via high volume seeking to validate the new support.
Bar 26: Bar 25 hints at an internal pullback, but Bar 26 invalidates that contraction by topping its high. The negation attracts heavy buying, generating a high-definition, high-volume candle. However, it prints an upper tail as it approaches resistance at $0.4570 without directly testing it. Due to the acceleration, it qualifies as a climax bar prone to inducing a pause or healthy correction.
Bar 27 (Developing Bar): Sets up profit-taking, trading below the $0.4570 level.
Trading Scenarios and Market Relevance
Mantle shows a solid floor build at $0.3864, but its immediate trajectory hinges on how it absorbs the current profit-taking:
Bullish Scenario: If buyers hold price above the 20 EMA during this pullback and break the resistance at $0.4570 with conviction, the asset will target the next structural level around $0.5061. A consolidation above that level would clear the path to challenge the medium-term downward trendline and attempt to break above $0.5948.
Bearish Scenario: If climax Bar 26 triggers a severe rejection and MNT loses the 20 EMA again, the probability of a bull trap increases. In that case, order flow will look to sweep remaining liquidity in the $0.3864 floor area.
Disclaimer: This analysis is published strictly for educational and informational purposes and does not constitute financial advice, investment recommendations, or an offer to buy or sell digital assets. Cryptocurrency trading involves a high degree of risk and volatility; conduct your own research before making operational decisions.

Communications Professional. Crypto Enthusiast. Economic Journalist. Bitcoiner & Altcoiner.