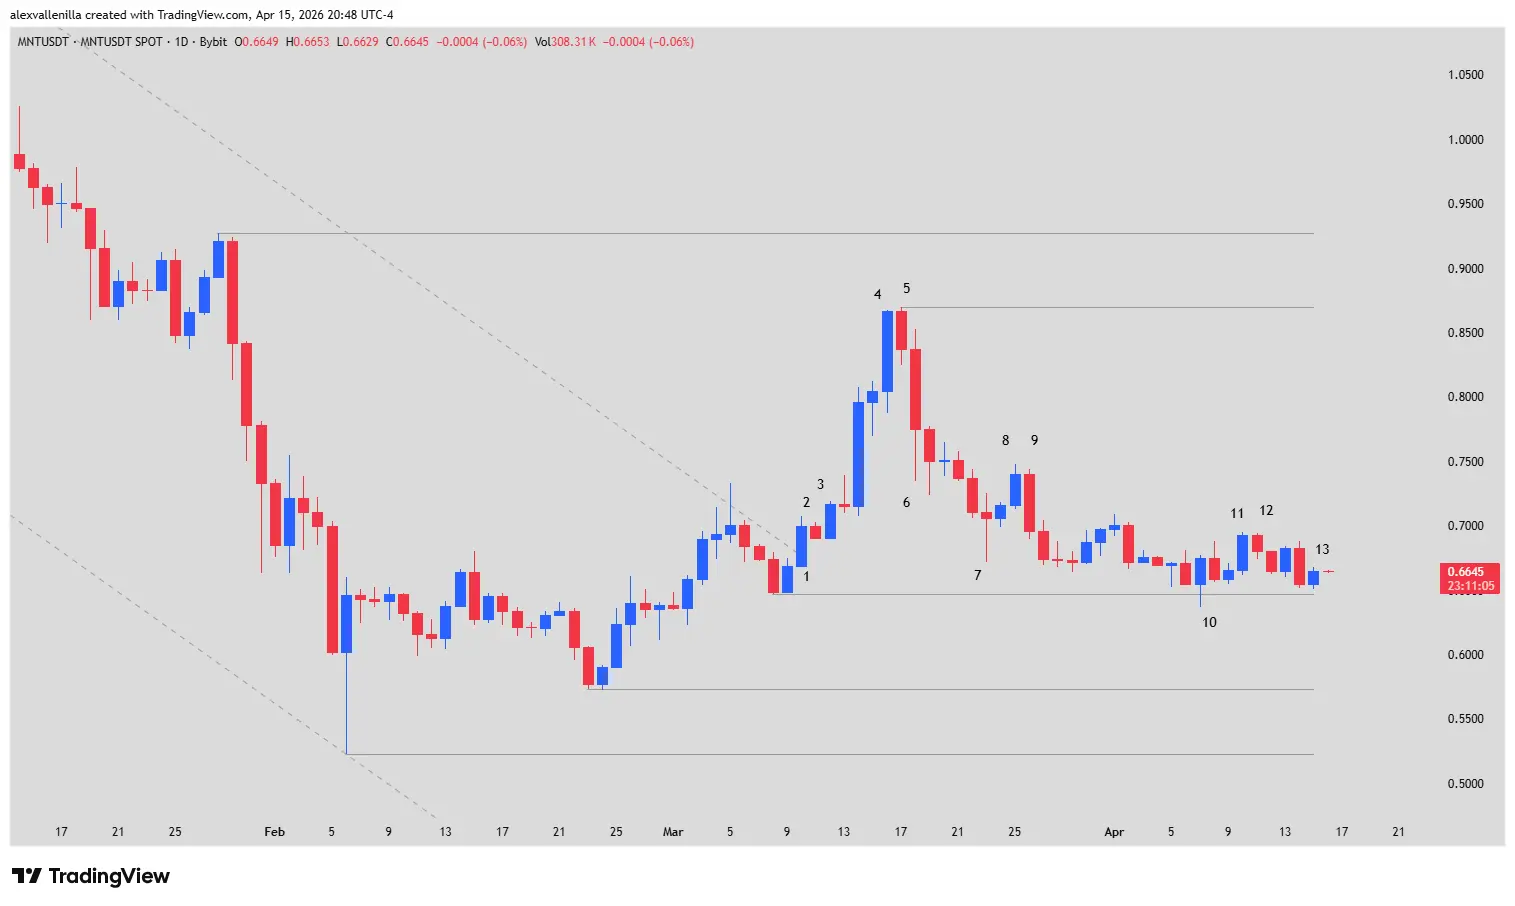
After a prolonged technical winter of 86 days under bearish dominance, the MNT (Mantle) asset finally managed to break its descending trendline, entering a critical technical resolution phase. In the last 24 hours, the token closed at $0.6649, reflecting a marginal gain of 1.60%. Despite this breather, the asset carries a negative annual performance of -5.04% and a Year-to-Date (YTD) drop of 30.99%. The market is now debating whether the recent sideways price action between $0.6473 and $0.7500 represents a solid accumulation base or simply a pause before testing lower levels, as the Mantle network bets on operational efficiency through the arrival of AI agents like Starchild.
Between the Breakout and the Range: The Market Pulse
The Mantle narrative has shifted drastically. The breakout of the 86-bar trendline did not bring the vertical rally many expected; instead, it led to a transition into a Trading Range. This behavior is educational: markets rarely move from an aggressive bearish trend to a bullish one without first passing through an equilibrium phase where supply and demand neutralize each other.
The recent announcement regarding the integration of Starchild—which allows for contract deployment and DeFi position management via AI agents—provides a fundamental catalyst that could support long-term value, even though the price chart still shows scars of indecision.
Technical Analysis: Price Action Chronicle (Bar by Bar)
The behavior of the recent sessions is an open manual on trader psychology. Below, we break down the technical narrative based on bar numbering:
Bars 1 to 3 (The Changing of the Guard): Bar 1 executed a strong 4.70% breakout, halting months of declines. After a Bar 2 that failed to push the price back into the channel, Bar 3 acted as a High 1 (H1) setup, confirming that buyers were ready to defend the new ground.
Bars 4 and 5 (The FOMO Trap): Bar 4 showed notable bullish conviction, but Bar 5 marked a high at $0.8698 before quickly reversing. This was a classic trap for premature bulls; those who bought the Bar 4 close out of Fear Of Missing Out (FOMO) were caught by immediate profit-taking.
Bars 6 to 9 (The Return of the Bears): Bar 6 functioned as a Bear Surprise, wiping out previous gains. Although Bar 7 showed defense at the lows (lower wick), Bar 9 reaffirmed selling pressure, invalidating any attempts at an immediate bullish pullback.
Bars 10 to 13 (The Micro-Battle at Support): Bar 10 is fundamental: it executed a False Breakout of the $0.6473 support, closing above it and demonstrating institutional demand in that zone. Bar 11 attempted to break the congestion, but Bar 12 (Inside Bar) and Bar 13 (equilibrium Doji) confirm the market is at a “deadlock” with decreasing volatility.
The $0.6473 level currently acts as a “magnet.” Price constantly gravitates toward it, indicating the market is searching for fair value before the next expansive move.
Projections: Investor Scenarios
Bullish Scenario (Accumulation): To resume a structure of higher highs, MNT must close with a solid body above the $0.7500 resistance and, eventually, challenge the $0.9269 psychological level. The formation of a “Double Bottom” between Bar 10 and Bar 13 suggests the floor could be near.
Bearish Scenario (Capitulation): A daily close below $0.6470 would invalidate the accumulation thesis, opening the door to the next technical support at $0.5734.
Patience in the Compression Zone
Mantle is in a technical “digestion” phase. While AI and RWA (Real World Assets) fundamentals expand, price requires a range breakout with volume to confirm its next destination. For now, scalpers remain in control.
Disclaimer: This analysis is for informational and educational purposes only. It does not constitute financial advice or investment recommendations. Cryptocurrencies are high-volatility assets.
Communications Professional. Crypto Enthusiast. Economic Journalist. Bitcoiner & Altcoiner.