The cryptocurrency OKB marks a decisive milestone in its daily (1D) market structure. After completing a 69-bar accumulation process and neutralizing the key resistance at $99.71—the last lower high of the macro downtrend—the asset positioned itself in a critical pre-bullish transition phase. Aggressive order flow, characterized by high-conviction shaved-bottom bars and volume doubling the daily average, confirms the return of institutional capital, driving the price past the psychological $100 mark.
The Architecture of the Move: From Congestion to Breakout
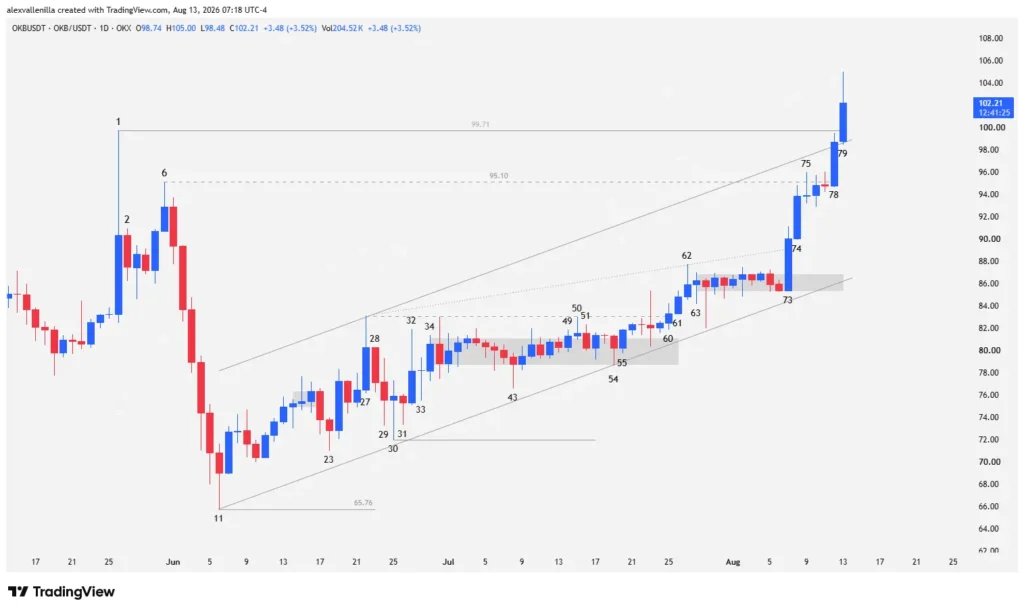
The market dynamics for OKB have not been accidental. Over the past few weeks, the daily chart built a counter-trend structure inside a 69-bar ascending channel originating from the low of bar 11.
Throughout this trajectory, the asset faced severe congestion points. After timidly clearing resistance at $83.09 (high of bar 27) via an ascending right-triangle pattern, momentum temporarily faltered. Upper wicks on bar 62 signaled profit-taking and supply-side selling pressure. This led to a “barbed wire” pattern—a 10-session tight trading range between bars 63 and 73.
However, the lower boundary of the ascending channel acted as unbreakable dynamic support, keeping higher lows compressed and priming the liquidity necessary for the institutional move.
Price Action Narrative: Bar-by-Bar Technical Breakdown
A detailed study of the Japanese candlesticks and trading volume reveals the underlying psychology of market participants across the chart’s recent stages:
Bar 54: Its low allows for a readjustment of the 69-bar ascending trendline, consolidating the lower boundary of the counter-trend channel.
Bar 55: Confirms the strength of the footing established at bar 54 by breaking above its high.
Bar 60: Marginally breaks the $83.09 resistance (high of bar 27). This move validates the resolution of an ascending right triangle compressed against the channel’s lower boundary.
Bars 61 and 62: Bar 61 confirms the previous breakout, while bar 62 signals a loss of momentum. Its upper wick and volume spike warn of active supply. The high of bar 62 projects an upper boundary that outlines a rising wedge.
Bar 63: Fails to break the previous high and closes below it, initiating a 10-bar congestion phase (“barbed wire”) supported above the ascending trendline.
Bar 73 (Inflection Point): Smart money surges into the market. A high-conviction bullish candle prints with a shaved bottom (no lower wick), indicating that buying pressure controlled the session right from the open. The bar breaks the barbed-wire pattern and the top of the rising wedge, executing a “wedge failure” alongside volume doubling the daily average.
Bar 74: Revalidates the bar 73 breakout with a second consecutive day featuring a shaved bottom and high volume. Although buyers take full control of the trend, the bar caps its high right before testing $95.10 (high of bar 6).
Bars 75 to 78: Following a failed attempt to break $95.10 on bar 75, price avoids an aggressive pullback. Bar 77 absorbs supply as a failed pullback, and Bar 78 accelerates aggressively: it shatters the high of bar 6, blows through the top of the 69-bar channel, and wipes out shorts on heavy volume.
Bar 79 (In Progress): Trades above $100.00 and tests critical resistance at $99.71 (high of bar 1). By clearing this level, the bar generates an overshooting move that invalidates the last major bull trap of the primary downtrend.
Performance Metrics and Operational Scenarios
OKB’s year-over-year performance reflects renewed financial health within the digital asset ecosystem:
| Period | Change (%) | Market Context |
|---|---|---|
| Past 12 Months | +119.76% | Strong long-term structural accumulation. |
| Past 3 Months | +20.27% | Development of the counter-trend ascending channel. |
| Past Month | +27.40% | Acceleration phase triggered by the rising wedge breakout. |
| Year 2026 (YTD) | -6.72% | Absorption of the pullback leading into the pre-bull run phase. |
Strategic Outlook:
Bullish Scenario: Solid consolidation on daily closes above $99.71 confirms the macro structure shift, unlocking liquidity toward the next major supply zone around $124.00.
Risk Scenario (Bull Trap): In the event of a sharp rejection before the close, the asset holds three key support levels:
First support: $95.10 (prior resistance from bar 6).
Dynamic support: Lower boundary of the counter-trend channel at $86.51.
Accumulation zone: The congestion area (bars 63–73) confluent at $86.00.
The breakout above the rising wedge and the active test of $99.71 showcase the effectiveness of price action reading. OKB has not only left weeks of congestion behind, but it has officially entered a pre-bull run environment backed by institutional supply absorption.
Disclaimer: This analysis is strictly for informational and educational purposes, based on Price Action methodologies. It does not constitute investment advice or financial guidance. Digital assets carry high volatility and capital risk.

Communications Professional. Crypto Enthusiast. Economic Journalist. Bitcoiner & Altcoiner.