

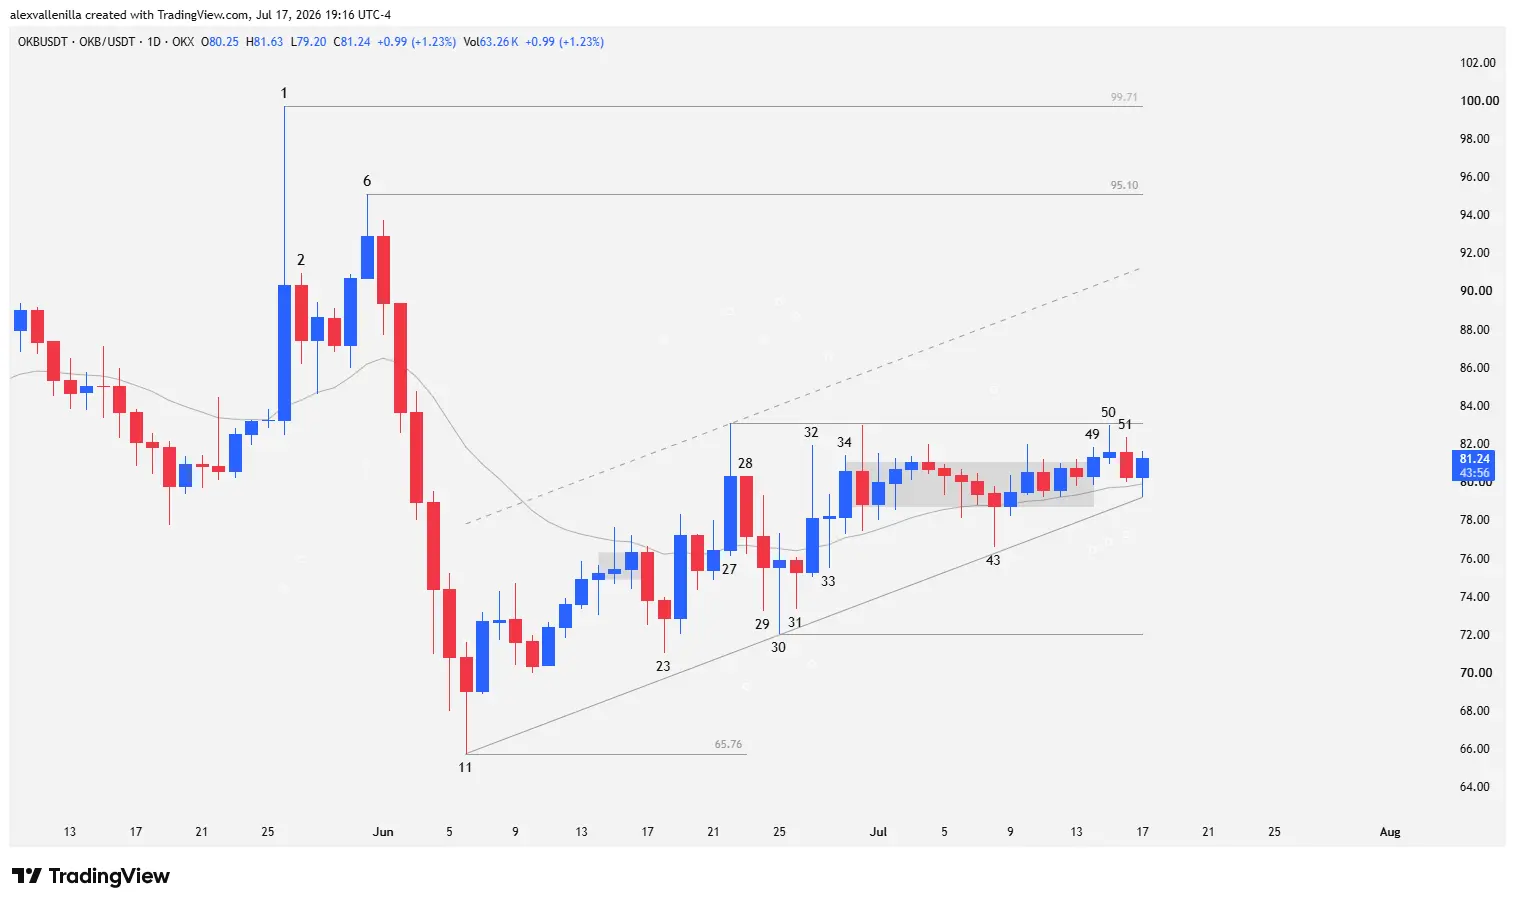
OKB buyers are sustaining a short-term countertrend rally on the daily (1D) chart, facing immediate psychological and technical resistance at $83.09. Despite the long-term structural bearish pressure dominating the asset, order flow is carving out a geometric compression above the 20-period exponential moving average (20 EMA). This battle between supply absorption and bullish exhaustion will define the token’s direction over the coming sessions.
The Structural Context: A Mini Channel Against the Grain
The OKB ecosystem is experiencing a marked technical relief rally. Price is moving within a short-term bullish mini channel spanning 41 bars of development. However, traders must remain cautious: this upside move constitutes a countertrend structure against a mature, primary bearish cycle that carries over 320 bars of macro control by sellers.
The real challenge lies in the loss of momentum the asset has shown since hitting the upper band of this minor channel, shifting the vertical rally into a lateral consolidation process.
Price Action: Anatomy of the Order Flow
Candlestick behavior reveals the current psychology of market participants, cleanly divided into three recent operational phases:
1. Initial Rejection and the Battle for the 20 EMA (Bars 27 to 31)
Bar 27: Bulls extend the previous momentum and manage to close the session above the 20 EMA. However, a notable upper tail establishes local resistance at $83.09. This high defines the projection line for the roof of the short-term bullish channel.
Bar 28: The market prints an Inside Bar with a bearish close. The lack of continuity immediately traps late buyers who entered on the breakout of the previous bar.
Bar 29: Volatility shakes the market with a wide-range bar exhibiting long wicks on both ends. Bears win the session by dragging the closing price below the flat 20 EMA and the low of bar 28. Despite the drop, this move establishes a higher low compared to bars 23 and 11.
Bar 30: Sellers attempt to extend the sell-off, but demand aggressively absorbs the supply. The result is a Hammer whose low at $72.01 acts as local support and the official anchor for the lower trendline of the 41-bar channel. Buyers, however, fail to close the bar above the 20 EMA.
Bar 31: An Inside Bar reflects a temporary capitulation from both sides and the start of a consolidation phase.
2. Bullish Attack and Transition to a Micro Range (Bars 32 to 42)
Bar 32: Buyers retake the offensive and pierce the 20 EMA to the upside. The move shows weakness as it fails to test the key resistance at $83.09, leaving an upper wick larger than the candle body itself.
Bar 33: Price prints another consolidating Inside Bar, but this time defending the upper area of the 20 EMA against bearish attacks.
Bar 34: Bulls achieve continuity above the previous high, but price again falls short in its attempt to squeeze the $83.09 ceiling. Starting from bar 35, the market enters a prolonged congestion or micro range, persistently floating above the 20 EMA.
3. Geometric Compression: The Ascending Triangle (Bars 43 to 51)
Bar 43: A Pinbar with a bearish close shakes the range. Its low approaches the lower trendline without touching it, closing slightly below the 20 EMA. Failing to find bearish follow-through on bar 44, this level validates a higher low relative to bars 30 and 11.
This sequence formalizes the construction of an ascending triangle: a structure where lows are consistently higher, but highs repeatedly hit the $83.09 wall.
Bar 49: A timid breakout attempt quickly aborts, generating a narrow-range candle that denotes buyer apathy.
Bar 50: A Pinbar with a bullish close (inverted hammer) appears. Price seeks to test $83.09, but sellers respond with a massive rejection that creates a huge upper tail. This confirms that demand lacks the necessary strength to force a breakout of the level.
Bar 51: Exploiting the previous rejection, bears break the low of bar 50. However, selling pressure quickly fades: price fails to violate the 50 EMA or the base of the bullish mini channel.
Critical Scenarios: Breakout Zones and Targets
The prolonged time price has spent above the 20 EMA gives OKB a slight bullish bias within the micro range. The market stands at a distribution or accumulation crossroads that will resolve under the following parameters:
Bullish Scenario: If buyers break resistance at $83.09 with volume and body, price will target the $95.10 area (bar 6 high). This level represents a former Bull Trap that frustrated the first macro trend reversal. Overcoming $95.10 and, subsequently, the bar 1 high at $99.71 would formally validate the birth of a medium-to-long-term bullish cycle.
Bearish Scenario: If price loses the 20 EMA and breaks the lower side of the bullish mini channel, it will invalidate the triangle structure. The immediate and critical support to watch sits at $72.01, the definitive anchor point holding the current countertrend structure together.
Disclaimer: This analysis is for strictly informational and educational purposes. It does not constitute financial advice, investment recommendations, or an offer to buy or sell digital assets.

Communications Professional. Crypto Enthusiast. Economic Journalist. Bitcoiner & Altcoiner.


