During recent sessions on the Internet Computer (ICP) daily chart, bitcoin experiences critical price compression above a multi-year floor of $2. We analyze the psychology behind 71 key bars, identifying how smart money manipulates residual liquidity, invalidates previous bullish structures, and challenges a medium-term bearish trendline amid a meticulously calculated accumulation range.
Impulse Dynamics and the Bull Trap
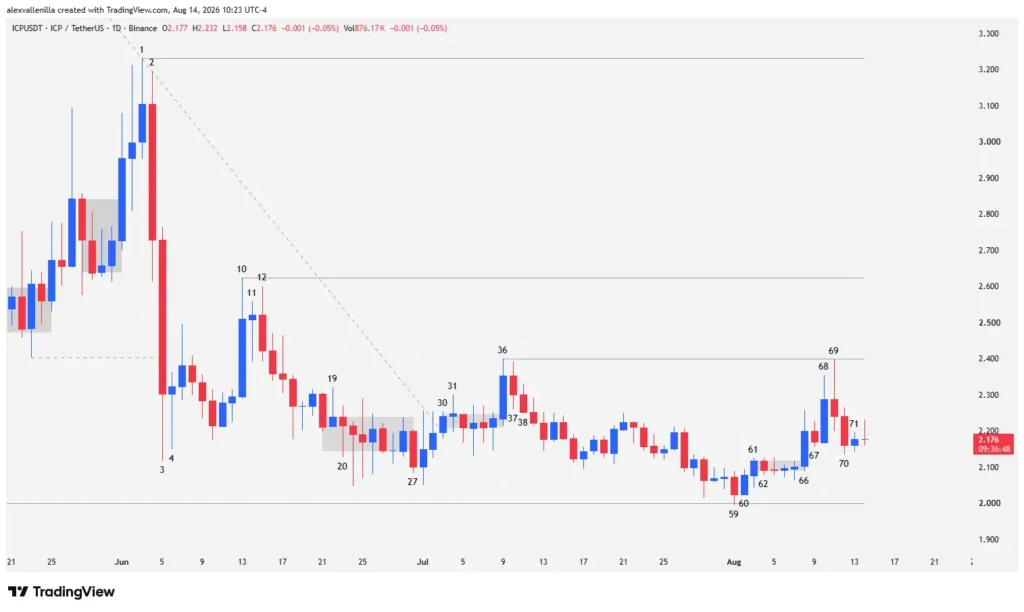
Technical development begins at bar 1, whose high sets resistance at $3.231. This structure shows clear deceleration by failing to surpass the previous bullish impulse from $2.403, falling well short of the $4.092 ceiling. This point anchors a bearish trendline of a 55-bar micro channel, subordinated to an 871-bar macro structure. Immediately, bar 2 unleashes high bearish conviction with notable volume that completely engulfs the previous body, sweeping preceding lows.
Bar 3 deepens the punishment by breaking the local support of $2.403, confirming the total invalidation of previous higher lows. However, it prints a massive lower wick that reveals institutional absorption and climactic behavior without reaching $2. Following a hammer-shaped bar 4 that temporarily halts the drop, price rebounds on bar 10, establishing a lower high at $2.624, trapping the quotation against a solid 189-session double floor anchored at $2.
Silent Accumulation and the Range Challenge
Between bars 19 and 35, the asset adopts a micro trading range characterized by tiny bodies and a barbed-wire pattern with marked indecision and low volumes, classically interpreted as a clean institutional accumulation zone. Although bar 30 attempts to breach the 55-bar bearish trendline, it lacks force and volume, generating a breakout failure that temporarily numbs the market into a four-session lateralization.
The bullish response takes shape on bar 36, breaking the pattern decisively toward $2.399, though without the energy of a high-conviction bar. Bars 37 and 38 structure a two-legged overlapping pullback down to bar 59, where bears unsuccessfully try to pierce $2. The reaction arrives instantly: bar 60 prints a solid bullish reversal candle that cancels the bearish fakeout, validated by the upside breakout of bar 61.
Technical Analysis (Top Priority): The Pulse Between Smart Money and Weak Hands
The climax of this range structure materializes between bars 66 and 71. Bar 66 pushes upward with power, though it collides with selling pressure that imprints a 30% upper wick on its range. After a pause on bar 67, bar 68 comes into play: smart money sweeps premature sellers’ stop-losses by surpassing the previous high, unleashing a 35% bullish rally from the $2 support, exhausting just before touching the bar 36 ceiling.
Immediately, bar 69 responds with a forceful large bearish pin bar, whose high falls just two ticks short of the $2.399 resistance, configuring a clear secondary double top pattern backed by high volume. Bar 70 yields ground to the downside, and bar 71 prints a narrow-range doji, sowing indecision and preparing the ground for the next directional move within this tight operational channel.
Internet Computer price action demonstrates that the market finds itself in a crucial phase of compression and institutional accumulation. The current equilibrium between rigorous defense of the $2 support and selling pressure at the $2.399 ceiling defines a high operational tension scenario. Overcoming these technical boundaries will dictate whether the asset manages to build a new recovery structure or definitively yields to the primary bearish trend.
Disclaimer: This analysis is for educational and informational purposes only. It does not constitute financial advice or an investment recommendation. Cryptocurrency trading carries a high level of risk; trade at your own risk.

Communications Professional. Crypto Enthusiast. Economic Journalist. Bitcoiner & Altcoiner.