The digital finance market is witnessing a crucial battle in Internet Computer (ICP) price action. Over the past few sessions, the crypto asset deployed an aggressive sequence of volatility on its daily (1D) chart. This price action encapsulates the classic dynamic between institutional capital absorption and weak-hand capitulation. Despite carrying a 36.52% contraction year-over-year, ICP exhibits remarkable resilience over shorter periods. It registers a 10.31% gain year-to-date in 2026, backed by a solid 27.24% rally this quarter and 32.68% over the past month.
Below, we break down the order flow narrative through a detailed technical analysis of its price action.
Chart Anatomy: Climactic Impulse and Supply Absorption
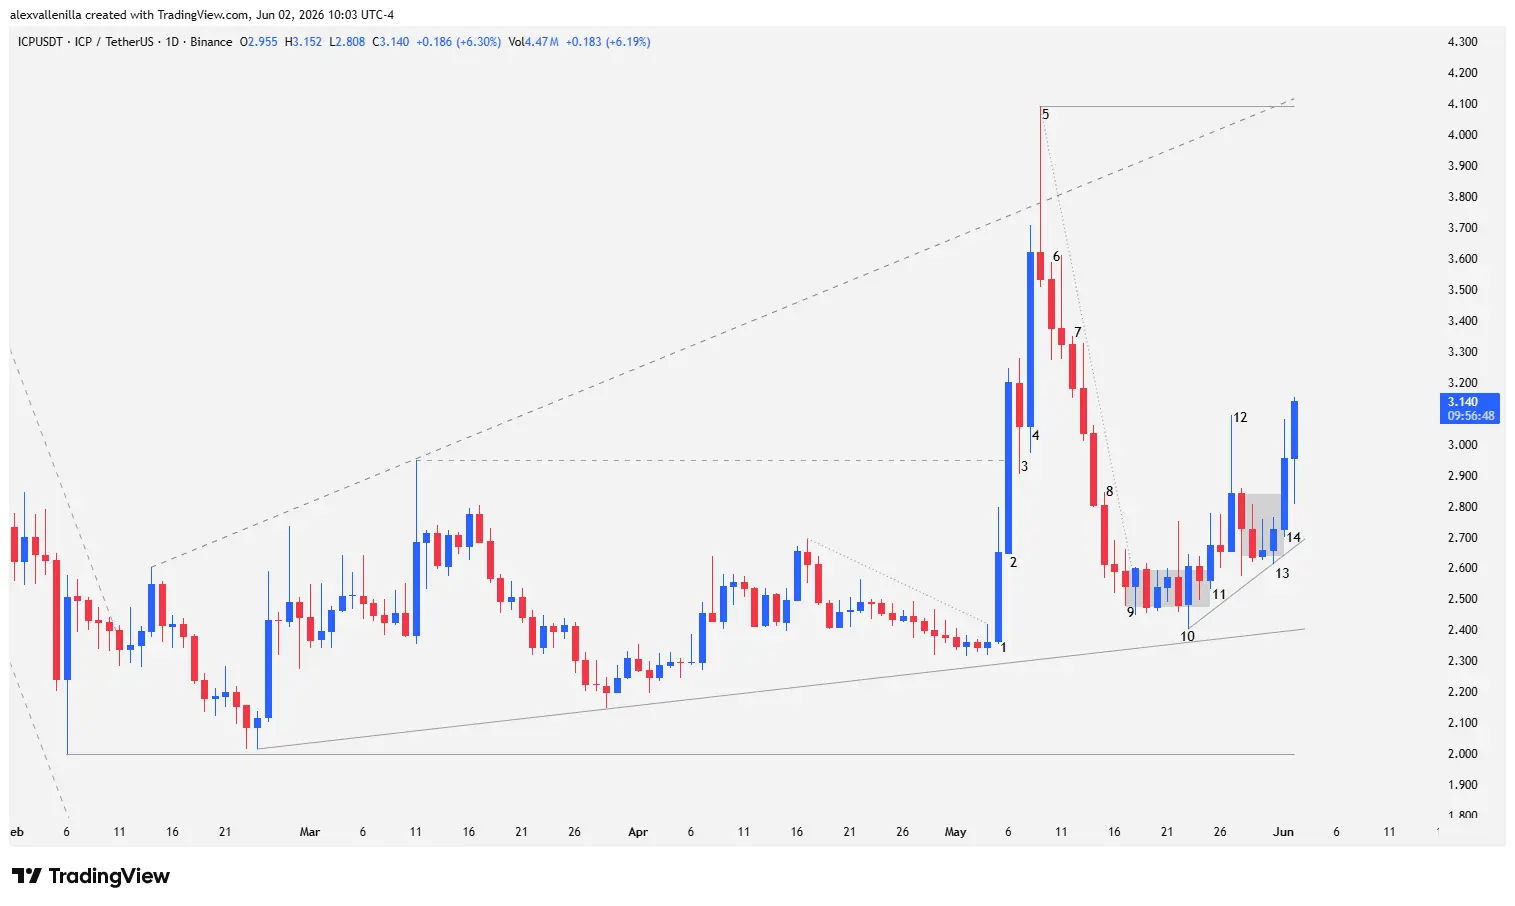
Structural analysis on the daily timeframe reveals that ICP is developing an ascending broadening wedge, a high-volatility formation that currently accumulates 99 bars of bullish trajectory. However, this movement breathes within a dominant macro context: a massive primary bearish trend spanning 796 bars.
Institutional Injection and Buying Climax (Bars 1 to 5)
The price reversal began with Bar 1, a high-conviction bullish candlestick that printed a 12.19% gain. This move broke a previous 17-bar bearish microchannel, maintaining a higher low aligned with the 99-candle macro structure. Although institutional buyers entered with force, retail profit-taking at the highs left an upper tail, preventing a test of the intermediate resistance at $2.94.
Contrarian institutional interest saw definitive confirmation in Bar 2. With an expansive 20.75% rally, this session became the largest range candle since the breakout of the last 27-bar bearish leg. The total absence of a lower tail (shaven bottom) demonstrates that buyers dominated the order flow right from the open. Although more than half of the body closed above the critical level, it failed to consolidate above the $2.94 resistance.
Following a weak pullback in Bar 3—where a lower tail the size of the body revealed the bears’ inability to pierce the new $2.94 support—the bulls unleashed Bar 4. This third expansive impulse registered an 18.33% increase with marginal tails. However, because it expanded vertically at the top of the structure without touching the upper boundary of the wedge, the market processed it as a climactic move (exhaustion due to excess speed).
Climax confirmation materialized in Bar 5, a textbook bearish pin bar. Its massive upper tail pierced the upper trendline of the broadening wedge, but sellers defended the zone, forcing a close below the directrix. This action established static resistance at $4.09, trapping late buyers in what technical analysis defines as a bull trap.
Weak-Hand Capitulation and the Accumulation Phase
“Sell the Rally” and the Search for Liquidity (Bars 6 to 9)
Bar 6 validated the trap by breaking the low of the previous session. In a macro bearish environment, institutional traders operated under the premise of selling rallies (distributing on bounces), pushing the price down in search of liquidity. Pressure continued into Bar 7 via a breakaway drop, albeit with smaller range candles.
Bearish acceleration peaked in Bar 8. Despite showing slightly wider bodies that denoted retail capitulation, the session closed with less conviction. This sent a clear signal: bears were running out of steam before they could test the lower support of the wedge.
The definitive loss of momentum was confirmed in Bar 9, an extremely small-bodied doji whose low remained well above dynamic support. The subsequent breakout of the 9-bar bearish microchannel gave way to a severe congestion phase or “barbed wire” pattern, a behavior characteristic of quiet accumulation zones.
Structural Bounce and the Roadmap (Bars 10 to 14)
The bullish turn began building from Bar 10, which printed a higher low relative to Bar 1, activating a secondary bullish trendline that has now been valid for 11 bars. Bar 11 acted as a shaved bar, closing outside the previous congestion range and invalidating short selling attempts.
After registering a new four-bar congestion pattern due to market indecision, Bar 12 managed a 7.04% advance, though its prominent upper tail revealed that supply remained active. In this environment, the low of Bar 13 functioned as a fundamental anchor: a higher low than its predecessors (Bars 10 and 11), confirming that institutional buyers are willing to absorb the asset at progressively higher prices. Finally, Bar 14 decisively broke the latest sideways range, consolidating volume entry at the lows following the capitulation.
Closing and Market Outlook
Internet Computer (ICP) price action demonstrates that the medium-term bullish structure remains intact. Theoretically, ascending broadening wedges complete after three major impulses. Having registered only two, the Bar 5 high at $4.09—which confluences with the dynamic resistance of the wedge at $4.11—currently acts as a powerful price magnet for the coming sessions.
To confirm a macro trend reversal, ICP needs to breach the $4.09 zone with volume and subsequently clear key resistance at $4.82 (the peak of the previous mini bearish trend). This would validate a definitive attack on the 796-bar primary bearish trendline. While this scenario plays out, the lower dynamic support at $2.40 stands as the bulls’ final line of defense.
Disclaimer: This technical analysis is issued exclusively for informational and educational purposes. It does not constitute, nor should it be interpreted as, financial advice, investment recommendations, or an invitation to execute buy/sell operations for digital assets. Crypto assets exhibit high volatility; risk only capital you are willing to lose.
Communications Professional. Crypto Enthusiast. Economic Journalist. Bitcoiner & Altcoiner.