Investors face a high-tension scenario in the decentralized finance ecosystem. The cryptocurrency ONDO tests its community’s patience and strategy, navigating a high-volatility phase where price action reveals a millimeter-precise tug-of-war between institutional hands and selling pressure.
Anatomy of a Critical Range
The digital asset ONDO (on its daily timeframe) stars in a deep technical correction after hitting a solid supply zone. The current movement plots a well-defined trading range that keeps pure technical analysis-oriented traders on alert.
Market structure shows how institutional buyers defend key liquidity levels, while sellers leverage every rally to place bearish positions, creating a scenario of market compression and traps.
Technical Analysis: Price Action Breakdown
The meticulous study of Japanese candlesticks, order flow, and the numerical sequence of bars decodes the current psychology behind the ONDO chart without relying on lagging indicators:
The Accumulation Phase and Initial Momentum
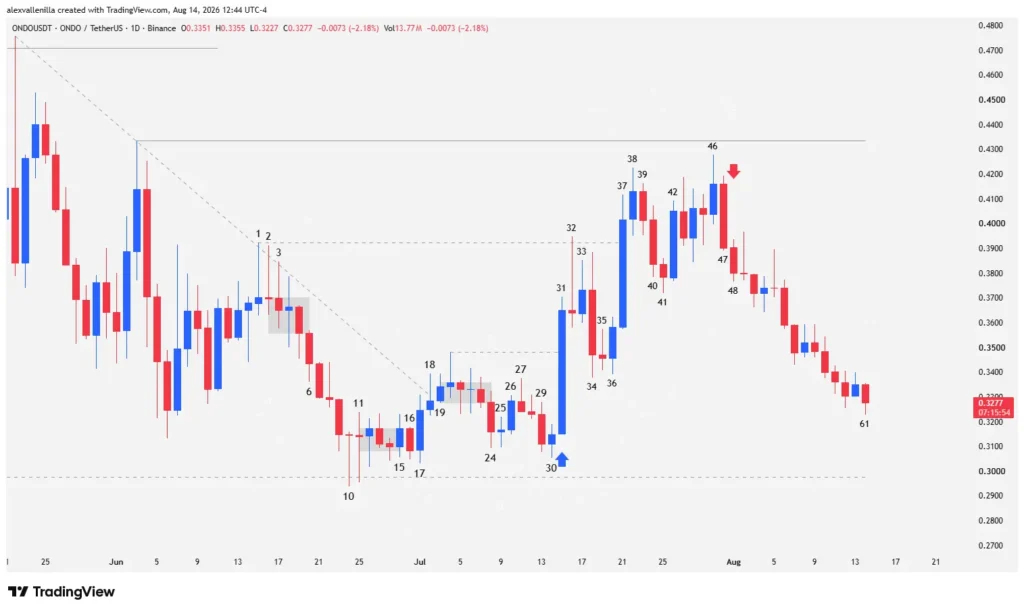
Bar 31 prints massive bullish conviction with high trading volume that surpasses the 20-day moving average. The absence of a lower tail proves that buying pressure flowed from the session’s start, confirming support at $0.2977 (Bar 30 low). This move breaks the prior 41-bar bearish trendline.
Later, Bar 32 tries to break above the Bar 1 high at $0.3923, but a strong rejection leaves a pinbar pattern (inverted hammer) with a long upper tail. Following a pullback failure at Bar 33, volatility returns with Bar 34 (a bearish outside bar), which Bar 36 quickly neutralizes, trapping sellers and printing a higher low.
The Second Push and the Double Top Pattern
Smart money reappears forcefully at Bar 37, a wide-range, high-volume candle breaking the $0.3923 resistance. However, the upper tail warns of resistance at $0.4334.
After a failed bull flag attempt between Bars 39 and 42, price targets the upper zone again. Bar 46 slightly exceeds the Bar 38 high, but lacks conviction, setting up a classic double top that highlights buyer exhaustion at the $0.4334 level.
The Sell Signal and the Tight Bear Channel
The bearish reaction arrives instantly: Bar 47 engulfs the body of the previous bar, generating a Low1 sell signal. This signal triggers and confirms at Bar 48 (setting up a high-probability Low2 after breaking the prior low), unleashing a drop within a tight bear channel down to Bar 61. However, this decline shows small bodies and multiple overlaps, exposing seller weakness and low conviction.
ONDO‘s technical behavior suggests a transition or accumulation phase inside a range bounded by the $0.2977 support and the $0.4334 resistance. If bears lose momentum as they approach the lower support, price will target the upper range boundary once again. A breakout and consolidation above $0.4334 invalidates the current bearish structure, opening the door to a new mid-term bull cycle.
Disclaimer: This analysis is for educational and informational purposes only. It does not constitute financial advice or an investment recommendation. The crypto asset market features high volatility; conduct your own research before trading.

Communications Professional. Crypto Enthusiast. Economic Journalist. Bitcoiner & Altcoiner.