

The Real-World Asset (RWA) market is once again capturing investor attention after a prolonged sideways slumber. During today’s session, the ONDO cryptocurrency registered a violent bullish awakening, surging over 16% intraday and driving its price above $0.36. This move invalidates a local congestion channel and marks the first serious attempt to break out of the accumulation phase that dominated price action for weeks. Following a rigorous institutional defense of its key support zone at $0.2977, bulls took the initiative in what is shaping up to be a cycle shift in daily price action.
The Macro Context: Between Bearish Legacy and the Accumulation Range
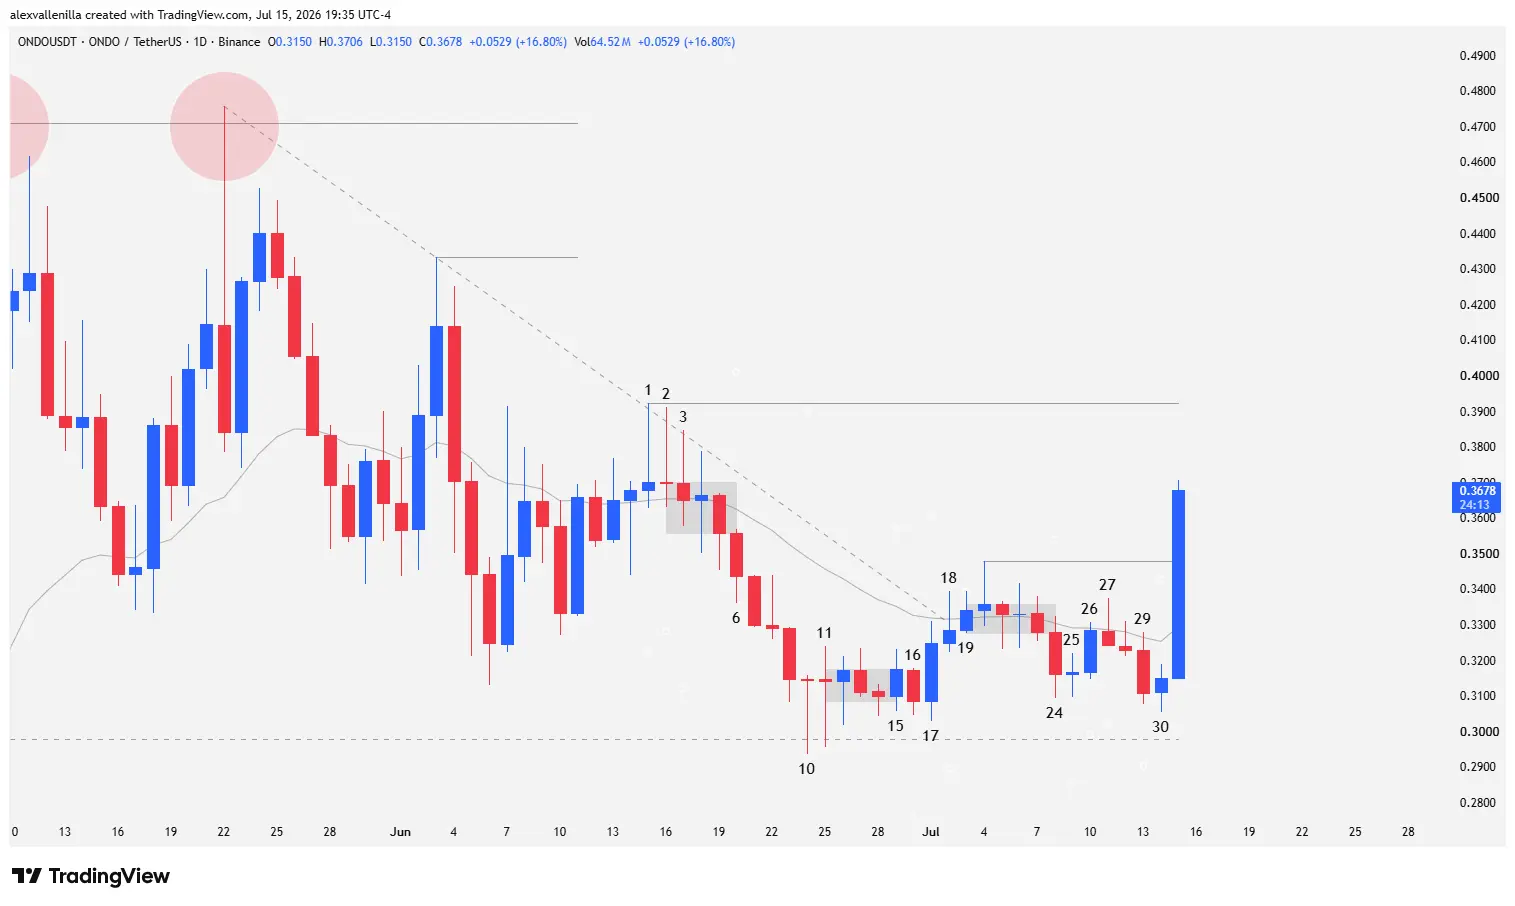
ONDO’s overall structure reflects the classic transition from a bear market to an accumulation process. After facing severe rejection at the $0.4709 macro resistance—a level representing the last lower high of the 154-bar downtrend—the price got trapped in a 41-bar short-term correction. This pullback, characterized by lower highs, prevented the immediate formation of a healthy medium-term uptrend, trapping early buyers under heavy selling pressure.
However, as it approached lower levels, price action began to show a clear deceleration in selling pressure. The bears’ loss of momentum facilitated sideways movement and the subsequent absorption of supply within a defined accumulation zone, paving the way for the current breakout.
Detailed Technical Analysis: Bar-by-Bar Market Psychology
The daily (1D) chart offers a textbook reading of order flow through the direct interaction of candlesticks:
1. Bull Failure and the Selling Trap (Bars 1 to 6)
Bar 1 represents the buyers’ failed attempt to regain control, colliding directly with the 41-bar downtrend line. Marking a local lower high at $0.3923, the session closed as a pinbar with a large upper wick. This demonstrated that bears aggressively absorbed the available demand. Bar 2 confirmed this weakness, printing a doji candle with a predominant upper shadow that failed to even test the previous high.
By Bar 3, the market printed another bearish-closing pinbar intertwined with the flat 20-period Exponential Moving Average (20 EMA). This cluster of upper shadows completed a pattern of strong selling pressure, triggering a high-probability Low 2 short entry setup. Sell orders executed on Bar 4 upon breaking the previous low, plunging the price into a micro-congestion range that Bar 6 eventually broke to the downside, continuing the corrective momentum.
2. Supply Capitulation and Key Support Defense (Bars 10 to 16)
The bearish momentum culminated after three pushes on Bar 10, a doji candle with a prominent lower wick that managed to pierce key support at $0.2977 (previous resistance and the ceiling of the prior accumulation zone). The following day, Bar 11 failed to provide bearish continuity, printing a rejection pinbar with a long lower wick that showed buyers absorbing the floating supply.
Bar 12 repeated the large lower shadow, structuring a buying pressure pattern. Although price congested in a micro-range until Bar 15, breakout attempts from both sides lacked conviction. Bar 15 attempted an upside breakout with an extremely small body, while Bar 16 failed in its pullback by remaining completely overlapped within the previous session’s range, proving that sellers had exhausted their strength in the lower zone.
3. Trendline Breakout and the Re-accumulation Phase (Bars 17 to 30)
On Bar 17, bulls renewed their attack to press the 20 EMA, achieving a key milestone on Bar 18: the definitive breakout of the 41-bar downtrend line. Although the large upper wick reflected that sellers were still defending the area, the medium-term corrective structure was neutralized.
The market entered a sideways consolidation phase. After establishing a new local resistance at $0.3480 (set on Bar 20), bears attempted to force a range breakout on Bar 24. However, the candle ended up with a very narrow range and wicks on both ends. Bar 25 confirmed the bearish failure with a Tweezer Bottom pattern that neutralized the drop.
Despite market traps on Bar 27 (an inverted hammer) and selling pressure on Bar 29, sellers consistently failed to test critical support at $0.2977, proving the passive accumulation of buy orders.
4. Bar 31: Strong Hands Step In
Bar 31 (the current session in progress) represents the confirmation of the accumulation phase. Buyers printed a powerful wide-range candle, completely shaved at its bottom, indicating absolute control of demand right from the market open.
This candle strongly crosses the 20 EMA, positioning most of its body above it, and solidly breaks resistance at $0.3480. If the daily close consolidates this level, ONDO will confirm the breakout of the sideways congestion pattern, opening the path to target the next local resistance at $0.3923.
ONDO’s technical behavior exposes a clean transition from a bearish structure to a highly solid institutional re-accumulation phase. The current session, driven by a performance of over 16%, proves that the $0.2977 support has been validated as a high-demand zone for strong hands. A firm close above $0.3480 will confirm that the short-term bias has shifted to bullish, clearing the path for the cryptocurrency to reclaim its lost medium-term highs.
Disclaimer: This article is presented for informational and educational purposes only. Price action analysis in crypto assets carries high risk due to market volatility. It does not constitute investment advice or a recommendation to buy or sell digital assets.

Communications Professional. Crypto Enthusiast. Economic Journalist. Bitcoiner & Altcoiner.


