The digital asset market is experiencing a high-volatility bullish jolt. After weeks of price compression and fierce defense of support levels, Ethereum (ETH) is driving an explosive breakout on its daily chart. Price action reveals clear smart money intervention, pushing the rate above the critical resistance level at $2,006 and threatening to liquidate the macro bearish structure that was dominating the primary trend.
From Range-Bound to Breakout: The Path of Price
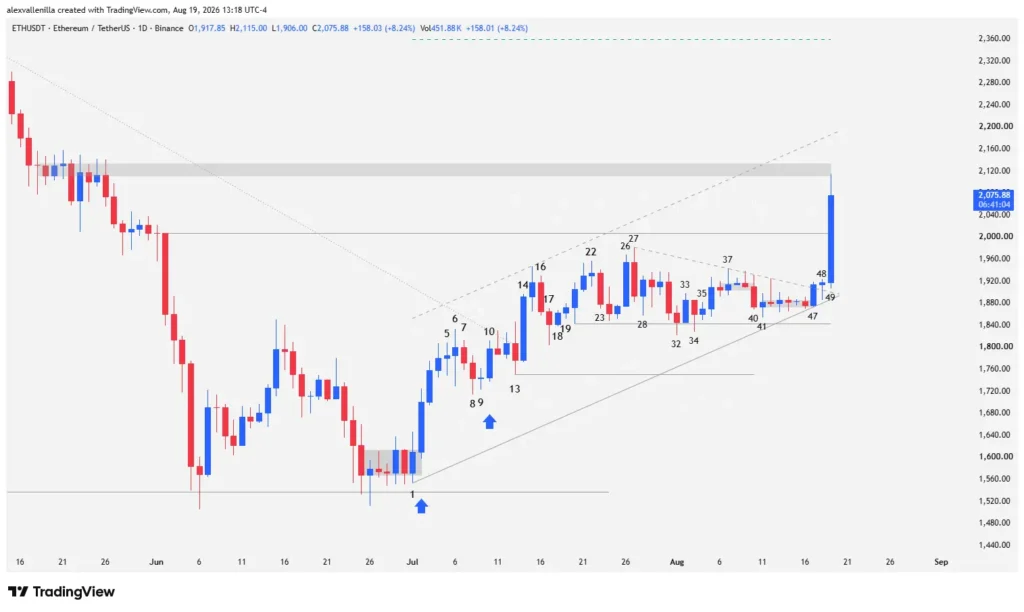
Order flow on Ethereum’s daily chart built a silent accumulation narrative before the current explosion. Buyers fought a hard-fought battle against supply, successfully defending the Bar 20 low zone at $1,843.
Despite multiple bearish pushes and compressing chart patterns, demand systematically absorbed every attempt at a downside breakdown, laying the groundwork for the institutional move currently unfolding.
Price Action Technical Analysis: Anatomy of the Order Flow
Compression Phases and Breakout Failures (Bars 26 to 46)
Bar 26: Buyers print a high-conviction bullish momentum bar. This candle invalidates the pullback from Bars 23 and 24, confirming support at $1,843 (Bar 20 low) and invalidating the previous breakout of an ascending wedge drawn from Bar 1 to Bar 22.
Bars 27 and 28: Bar 27 attempts to engulf the body of Bar 26 without success. Bar 28 immediately generates a failed pullback, showing a prominent lower tail that reveals demand actively defending $1,843.
Bars 32 to 34: Sellers temporarily pierce the $1,843 support level on Bar 32, but fail to secure a close below it. Bar 33 acts as a bear trap reversal. Bar 34 makes a second failed attempt at $1,843. The supply side’s inability to confirm the breakdown attracts institutional buyers.
Bars 35 to 40: Bar 35 consolidates as a bullish inside candle. Bar 37 then prints an inverted hammer that defines a 24-bar descending trendline from the Bar 27 high, initiating a descending right-triangle formation. Bar 40 breaks out of the congestion but fails to test key support.
Bars 41 to 46: Bar 41 invalidates the bearish follow-through and traps sellers. From this point forward, price action enters a severe “barbed wire” congestion pattern, characterized by extremely small bodies and multiple directionless wicks.
Structure Break and Order Flow Winners (Bars 47 to 49)
Bar 47: Bulls break out of the congestion. The candle manages to close above the 24-bar micro-downtrend. Its low acts as an anchor for a nascent bull channel within the last 50 bars, consolidating after the earlier breakout of a primary 182-bar downtrend line.
Bar 48: Sets up a tight-range bullish pinbar. It holds its body above the 24-bar trendline broken in the previous session, confirming the breakout, albeit on moderate volume.
Bar 49 (Current Session in Progress): Smart money enters the market with a high-conviction, wide-range candle. Price expands 8.67%, confirming the descending triangle breakout and violently destroying resistance at $2,006. The candle shows negligible wicks, demonstrating absolute demand dominance. Currently, the Bar 49 high is testing an extended congestion zone with immediate resistance sitting at $2,111.
Macro Context and Target Projections
Ethereum‘s current move formally breaks the consolidation that had been in place since Bar 20. If Bar 49 manages to close and hold half of its body above the $2,006 level, the market structure validates a second leg up projected from the initial push from Bar 1 to Bar 22.
Bullish Target: Applying a Measured Move metric from the Bar 1 low to Bar 22, the target for the second leg sits at $2,360. This level converges with the macro resistance zone at $2,420. Consolidation above $2,420 would mark the definitive end of the primary downtrend that began 360 bars ago.
Risk Scenario: If buyers lose traction and fail to close the session above $2,006, the chart would print a double top pattern with the Bar 27 high. This failure would open the door for a pullback to retest primary support at $1,843.
Dominant Bias: Ever since Bar 1, smart money has shown a clear accumulation phase through high-conviction impulse candles (Bars 2, 14, 26, and 49), while intermediate pullbacks have lacked volume and depth.
Ethereum’s price action demonstrates the power of pure chart analysis. The violent expansion of Bar 49 redefines ETH’s technical landscape; if demand consolidates current levels, the asset will not only confirm the validity of the new 50-bar ascending channel, but will also position itself to challenge long-term bearish market structures.
Disclaimer: The content of this article is strictly for informational and educational purposes based on technical price action analysis. It does not constitute, and should not be considered, financial advice, investment advice, or a trading recommendation.

Communications Professional. Crypto Enthusiast. Economic Journalist. Bitcoiner & Altcoiner.