

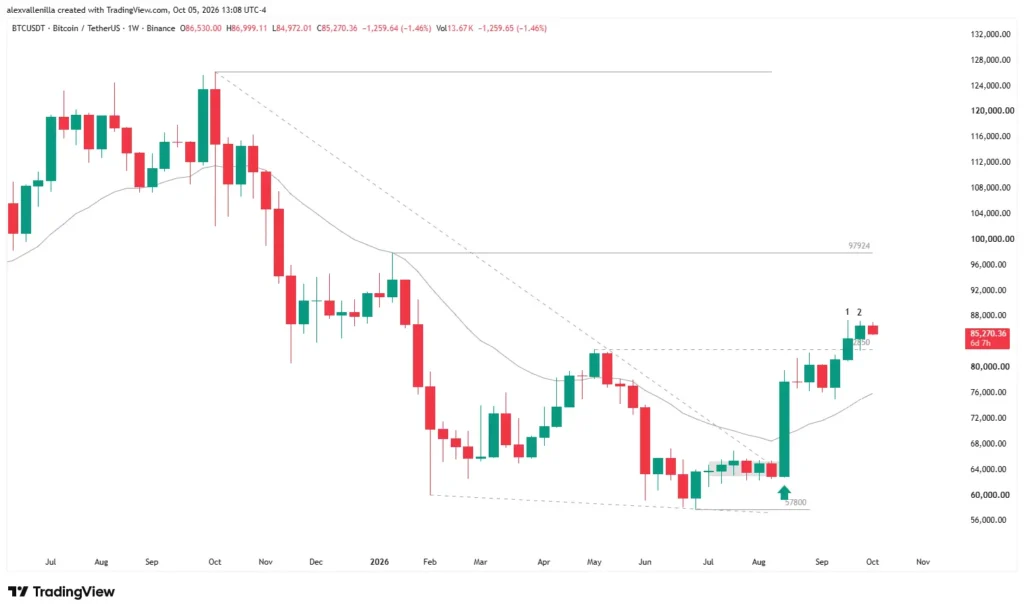
The bitcoin market reaffirms its bullish structure by closing the latest week above the $83,000 psychological barrier. Following the rally initiated in late June, the leading cryptocurrency enters a compression phase that suggests the accumulation of energy needed to push toward the $98,000 technical target. With supply absorbed at key levels and the 20-period exponential moving average (20 EMA) acting as primary dynamic support, order flow continues to favor buyers on the weekly timeframe.
Market Structure: Continuity and Higher Lows
The uptrend unfolded from the June bottom keeps its market geometry intact. During the latest expansion phase, price printed a new Higher Low, confirming that demand steps in aggressively at higher prices.
The prior breakout of the medium-term downtrend line transferred operational control to buying forces. Since then, buyers use every pullback as a liquidity absorption opportunity rather than a massive inventory distribution. As long as the asset maintains weekly closes above the $83,000 defensive zone, the structure displays no fracture in its medium-term dynamics.
Technical Analysis: Bar-by-Bar Price Action Reading
On the weekly chart, the price action accurately reflects supply and demand bias through recent range formation:
Bar 1 (Prior Impulse Bar): Represents the previous expansion move where demand pushed to the recent high at $87,400. This candle defined the dominant trading range and established the key swing high to break to validate a clean structural breakout.
Bar 2 (Inside Bar – Closed Week): The latest candle closed completely contained within the price range of Bar 1. This Inside Bar pattern highlights a period of pause and price compression, where volatility drops temporarily and supply fails to drive price lower. The fact that this pattern forms above $83,000 confirms buyers firmly defend gained ground without giving up territory.
Trading Scenarios and Order Flow
Bullish Trigger: A breakout above the Bar 1 high at $87,400 will trigger the Inside Bar bullish continuation signal. This move clears the technical path of least resistance toward the projected $98,000 target.
Support and Pullback Zone: If price sees temporary profit-taking, the critical area to monitor lies at the 20 EMA, which currently aligns with the structural low at $75,000. This level acts as the pivot floor that invalidates the medium-term bullish bias.
Bitcoin‘s current consolidation reinforces trend health: the market respects the higher-low structure and compresses volatility above key support before sweeping liquidity at new all-time highs.
Disclaimer: This analysis serves educational and informational purposes only. It does not constitute investment advice or financial guidance. Trading digital assets carries significant risk of capital loss.

Communications Professional. Crypto Enthusiast. Economic Journalist. Bitcoiner & Altcoiner.


