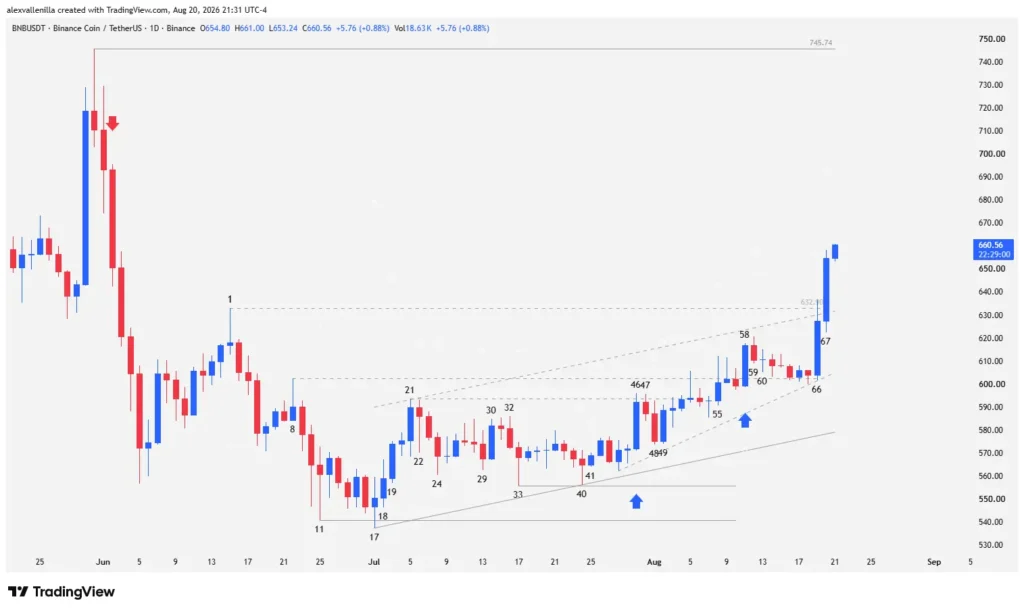
BNB price absorbs sell pressure at the key $632.90 resistance with a powerful breakout bar (Bar 67) that doubles average volume. After invalidating a rising wedge through an explosive move, the daily structure confirms incoming institutional demand and sets the stage to target the $746 resistance zone.
Price Action Dynamics on the BNB Daily Chart
The digital asset market shows a decisive transformation in Binance Coin’s (BNB) daily chart structure. Price cleanly cleared the technical hurdle at $632.90 (Bar 1 high), a level that marked the last swing high of the bearish impulse that unfolded from that bar down to the Bar 17 low.
This price action definitively invalidates the prior bearish bias and opens an upside expansion scenario that sets $746 as the next structural target. This level is critical: it represents the supply zone that generated a bull trap 82 bars ago, which led to a massive correction that ultimately bottomed out at key support near $540.60.
Technical Analysis: Bar-by-Bar Narrative and Order Flow
Resistance Absorption: Bars 55 to 57
The breakout process began to take shape when Bar 55 pushed past the previous Bar 21 high. However, price action printed a severe upper tail that significantly dwarfed its body. Although it managed to penetrate intermediate resistance at $602.31 (Bar 8 high), bears defended the zone and forced the close below it.
Subsequently, Bars 56 and 57 printed inverted hammer patterns with long upper shadows. This behavior reflected clear selling pressure and persistent rejection in the resistance area.
Invalidation and Conviction Breakout: Bar 58
Bulls responded with force in Bar 58. Demand delivered a high-conviction bar (essentially a Marubozu, free of significant upper or lower tails), trapping Bar 57 sellers and invalidating the selling pressure setup.
Accompanied by volume significantly higher than the 20-period average, Bar 58 closed almost entirely above $602.31. Despite the strength of the move, this bar’s high fell short of testing the upper boundary of the 51-bar bullish channel, showing a brief temporary deceleration.
Consolidation and Accumulation Phases: Bars 59 to 65
Bar 59: Bears attempted a pullback, but produced a narrow-range bar with no follow-through.
Bar 60: A doji with wicks on both ends confirmed temporary market indecision. Price made no attempt to test the new $602.31 support, nor did it follow through on the previous drop.
Bars 61 to 65: The market entered a congestion pattern marked by low-conviction bars and declining volume—typical of an institutional accumulation phase. During Bar 65, the $602.31 support saw a slight intra-bar breakdown, but the session closed firmly above the level.
Explosion, Bear Trap, and Definitive Breakout: Bars 66 and 67
Bar 66 marked the aggressive re-entry of demand. On volume that doubled the 20-day moving average, it confirmed support at $602.31. This bar’s low served as an anchor to draw an accelerated uptrend line, forming a rising wedge with the upper boundary of the previous channel.
Although Bar 66 managed to pierce key resistance at $632.90 (Bar 1 high) and the top of the wedge, intraday sell pressure forced a close back inside the structure. This move lured eager sellers between bars 59 and 66, setting up a bear trap.
Bar 67 delivered the pattern’s resolution. Acting as a continuation catalyst, this high-conviction bar showed almost no wicks and filled nearly its entire range. It posted a clean, solid breakout: more than half of its body closed above critical $632.90 resistance.
A volume expansion that more than doubled the 20-day average backed the move. Because the expected pullback toward the rising wedge’s lower boundary failed to materialize, the pattern broke down. In technical analysis, a failed rising wedge triggers an explosive move in favor of the prior trend, trapping bears and validating the rally’s strength.
Structural Projection and Summary
The decisive breakout above $632.90 concludes the previous bearish cycle. If demand maintains the two-leg momentum initiated from the Bar 17 low, BNB price moves toward the structural resistance zone at $746.
To preserve this medium-term bullish bias, any technical pullback must hold the former $632.90 resistance as new support. A bounce off this level would confirm a polarity flip. Conversely, losing this level again would signal a potential larger-scale bull trap.
Disclaimer: This analysis is for informational and educational purposes only, based on price action reading methodologies. It does not constitute financial advice, an investment recommendation, or an offer to buy or sell digital assets. The cryptocurrency market presents high volatility; perform your own research before making investment decisions.

Communications Professional. Crypto Enthusiast. Economic Journalist. Bitcoiner & Altcoiner.