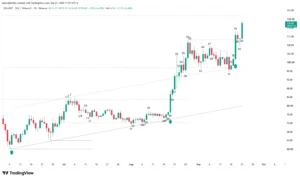
Bulls reclaimed the narrative in the Lighter (LIT) market. Following a prolonged compression phase and hints of a deep correction, LIT’s price registered a decisive breakout above its key resistance at $2.76. Backed by a substantial increase in trading volume, the move not only set a new all-time high at $3.06, but also confirmed the start of a second leg up on its daily structure.
The Bear Trap at the 95-Bar Trendline
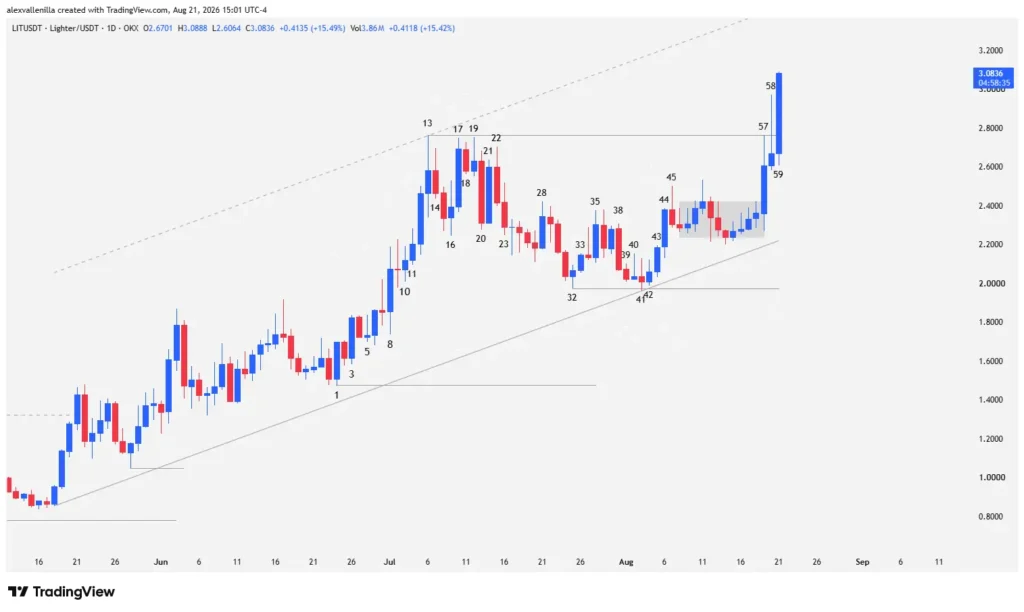
Recent price action in LIT demonstrates how institutional participants absorb supply in key liquidity pools. The asset maintained a primary ascending trendline extended over 95 bars on the daily chart. However, selling pressure tested the foundational structure at Bar 41.
At Bar 41, bears printed a red-bodied candle whose low adjusted the trendline and slightly undercut the previous support level from Bar 32 ($1.97). This move threatened to trigger massive stop-loss sell orders to detonate a deep correction. The bullish response was immediate: Bar 42 emerged as an inside blue-bodied candle that trapped early sellers from the previous bar. Confirmation of the bullish reversal arrived at Bar 43, surpassing the high of Bar 42.
Momentum accelerated at Bar 44, a high-conviction bullish candle that completed an acceleration pattern (where the body of Bar 42 was smaller than Bar 43, and Bar 43 smaller than Bar 44). Qualifying as a climax event, Bar 44 gave way to a natural pause. Bar 45 printed a upper tail reflecting profit-taking, confining price to a tight trading range (barbed wire pattern) for 11 consecutive sessions.
Supply Absorption at the $2.76 Resistance
The breakout from this compression occurred at Bar 57, when volatility returned to the market. Buyers pushed price to test the structural high of Bar 13 at $2.7626. Even though volume nearly doubled the 20-day moving average, Bar 57 left wicks on both ends—with a longer upper tail—evidencing fierce defense by the bears.
The battle for control continued at Bar 58. Bulls attempted to resume the previous trend, but supply absorbed demand, printing an upper-tail pinbar (inverted hammer) with a tiny body. The inability to close above resistance suggested potential buyer exhaustion in the short term.
Decisive Breakout and Technical Projection
Bar 59 (the developing session at the time of this report) drastically shifted the balance of power. Price cleanly pierced the Bar 13 resistance, with more than half of its bullish body trading above $2.76. This breakout drove a 14.32% gain in the session, logging a new all-time high (ATH) at $3.06.
From an order flow analysis perspective, the close of Bar 59 above $2.76 solidifies the opening of a second leg up. Applying the measured move rule to the first upward leg built through Bar 13, the asset projects a medium-term technical target in the $4.57 area.
Should a late rejection or profit-taking occur following the current breakout, the structure maintains clearly defined support levels:
Dynamic Support: The floor of the primary ascending channel sits at $2.21.
Fixed Support: The structural low of Bar 32 acts as the critical invalidation level at $1.97.
However, abnormally high volume and the large body size of Bar 59 support the institutional validity of the breakout.
Market Relevance
Price action in Lighter (LIT) demonstrates the effectiveness of candlestick reading and order flow over traditional technical analysis. The asset’s ability to absorb supply in a resistance zone tested multiple times confirms that smart money is accumulating the token, positioning it as one of the strongest relative performers in the current DeFi ecosystem.
Disclaimer: This article is strictly for informational and educational purposes regarding technical analysis. It does not constitute investment advice, financial planning, or an offer to buy or sell digital assets. Crypto assets carry high risk and volatility; always perform your own research (DYOR) before making financial decisions.

Communications Professional. Crypto Enthusiast. Economic Journalist. Bitcoiner & Altcoiner.