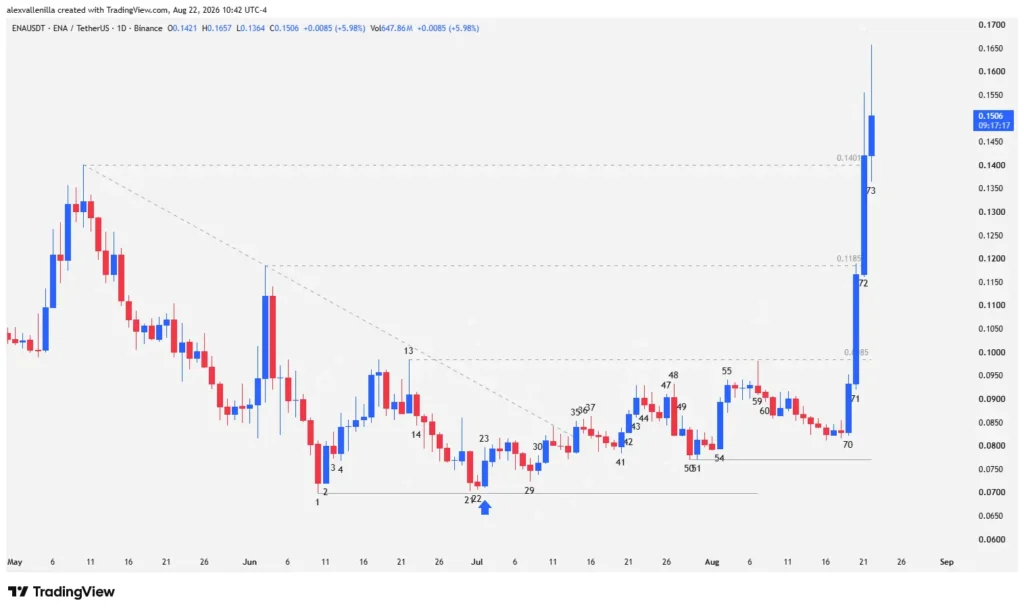
Ethena (ENA) is experiencing a sharp bullish reversal on its daily (1D) chart. After undergoing a prolonged compression phase and low volatility, buyers took complete control of the order book, punching through three key resistance zones to consolidate above the $0.1401 level. This movement definitively breaks a 65-bar secondary bearish structure and projects the price toward the $0.23 target in the medium term.
The Silent Accumulation That Triggered the Volatility Explosion
Over the past few sessions, ENA’s price action exhibited the classic hallmarks of an institutional accumulation process. After a failed bounce off the $0.0985 resistance level (marked by bar 59), the price entered a volatility contraction pattern.
Selling pressure progressively lost traction. The bears’ inability to print new lows confirmed a secondary support level at $0.0770—a higher defensive level than the previous low of $0.0699. This sequence of higher lows within a tight range telegraphed the eventual imbalance between supply and demand.
Technical Analysis: Bar-by-Bar Breakdown and Breakout Psychology
Analyzing the price action on the daily chart’s Japanese candlesticks reveals a narrative dominated by buyer absorption and seller surrender:
Bar 60: The Loss of Selling Momentum
Bar 60 confirmed the rejection at the $0.0985 resistance level. However, the subsequent downward move developed through extremely small candle bodies, declining volume, and a total absence of bearish conviction candles. This lack of fluid selling proved that the available market supply had dried up.
Bar 70: “Smart Money” Steps In
Bar 70 marked the shift in market behavior. This high-conviction bullish candle printed a low at $0.0770, closing virtually without a lower shadow and leaving only a minor upper wick. “Smart money” re-emerged on the chart, aggressively defending the support level just as they did on bar 54.
Bar 71: Violent Breakout From the Range Structure
Volatility and trading volume returned in full force on bar 71. Bulls violently shattered the key $0.0985 resistance (the high of bar 13), closing more than half of the candle’s body above this level. Bar 71 also sliced through the $0.1185 resistance, neutralizing the last major high of the secondary downtrend.
Bar 72: Parabolic Acceleration and Climactic Bar
Bar 72 delivered explosive continuation. Price action traders classify this as a climactic bar, displaying extreme acceleration compared to bars 70 and 71. Its momentum destroyed the structural resistance at $0.1401—the last bearish stronghold of the 65-bar trend that originated after a prior bull trap. Price closed comfortably above this level, completely invalidating the downward structure.
Bar 73 (In Progress): Consolidation Test and Profit-Taking
Bar 73 shows the inevitable cooldown following a parabolic move. Although trading volume remains high, the candle prints a pronounced upper shadow that reflects profit-taking by short-term traders. Despite the lack of immediate bullish continuation, price holds firm above the $0.1401 breakout level.
Projected Scenarios: The Path to $0.23
This structural shift gives buyers a clear tactical advantage. Invalidating the prior bearish structure transforms the asset’s dynamic from defensive to offensive.
If bulls successfully consolidate price above the $0.1401 zone on subsequent daily closes, the measured move projection—calculated from the range’s origin to the broken resistance—triggers a technical target toward the $0.23 area.
Conversely, should a deeper pullback occur, the first line of defense sits at $0.1185, followed by major support at $0.0985. As long as price holds above these operational floors, the bullish structure remains fully intact.
Ethena’s (ENA) aggressive response proves that the market absorbed the floating supply at the lows. Consolidating above $0.1401 not only clears out months of bearish pressure, but also lays the groundwork for a new structural trend across the digital asset market.
Disclaimer: The content of this article is for informational and educational purposes only. It does not constitute financial advice, an investment recommendation, or a solicitation to buy or sell digital assets. Always do your own research (DYOR) before making financial decisions.

Communications Professional. Crypto Enthusiast. Economic Journalist. Bitcoiner & Altcoiner.