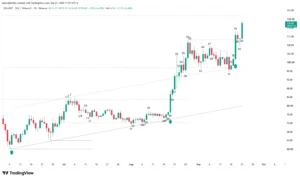
The MORPHO token confirms the completion of an accumulation pattern after aggressively breaking through the technical ceiling at $2.3678. Driven by trading volume triple its 20-day moving average, aggressive buy orders absorb available supply and solidify a breakout above its 199-bar macro uptrend line.
Macro Structure: End of Ranging Phase and Key Breakout
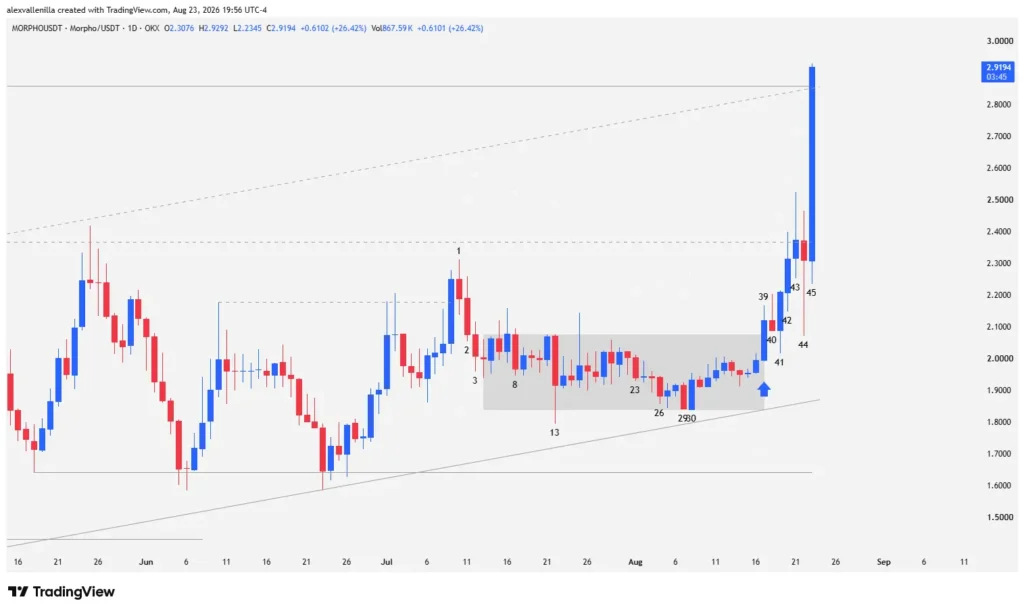
After initiating a primary uptrend from technical support at $0.96, the asset completed a two-legged expansion that formed a temporary top at $2.3678. Sellers failed to break the strategic floor at $1.6407, leading to a double bottom failure by the bears.
Price then consolidated inside an extended sideways range where capitulation attempts failed to build momentum below the trendline. Price action confirmed institutional accumulation ahead of the final surge.
Detailed Technical Analysis: Candlestick Breakdown and Order Flow
Bars 1 to 3: Floor Formation and Supply Failure
Bar 1 acts as a pullback bar following the end of the first expansion leg from $0.96 to $1.6407. High volume validates this technical pause. Although Bars 2 and 3 confirm the pullback by closing below the previous low, small candle bodies and upper/lower wicks on Bar 3 reveal a clear lack of selling conviction.
Bars 8 to 30: Compression and Institutional Double Bottom
Between Bars 8, 13, 23, 26, and 29, bears attempt to break the bottom of the channel without success. Each failed breakdown reinforces the strength of the 199-bar trendline. Bar 30, a low-range bullish outside bar, keeps its low above dynamic support, validating the trendline without touching it.
Bars 39 to 41: “High 2” Pattern Activation
Bar 39 breaks out of the range via a high-conviction candle backed by strong volume, setting up a High 2 continuation entry. Bar 40 attempts a pullback with an upper wick, but its high pushes past Bar 39, triggering buy stop orders. Bar 41 engulfs the previous bar with a lower wick, showing immediate supply absorption (trapped bears).
Bars 42 to 44: Battle at Critical Resistance
Volatility picks up in Bars 42 and 43 as price hits resistance at $2.3678. Bar 43 records volume triple its 20-day moving average, closing marginally above the key level. Although Bar 44 pulls back, its close above the previous bar’s low and its hammer shape confirm buyers stepping in at higher levels.
Bar 45: Climax Breakout and Overshooting
Bar 45 executes a massive range expansion, surging +25.59%. The candle has almost no wicks, reflecting total buyer dominance. Trading volume doubles the recent average. This move aggressively shatters $2.3678 resistance, overshoots the upper channel line, and breaks above the previous downtrend pivot at $2.9099.
Market Outlook and Conclusion
The price action in Bar 45 qualifies as a buying climax driven by institutional capital. After completing a extended two-leg cycle, the asset may pause or briefly consolidate before resuming its uptrend.
If buyers hold price above the newly broken resistance zone at $2.8593–$2.9099, the measured move projects a primary target of $3.4827, with potential to reach $4.1886 in upcoming sessions. If a technical pullback occurs, former resistance at $2.3678 will act as first support via polarity flip.
Disclaimer: This analysis is strictly for informational and educational purposes. It does not constitute investment advice or financial recommendations. Digital assets carry high volatility.

Communications Professional. Crypto Enthusiast. Economic Journalist. Bitcoiner & Altcoiner.