The crypto market gives no quarter, and the daily charts speak volumes once again. Following weeks of millimeter-tight compression and a fierce tug-of-war between supply and demand, the VIRTUAL token drives a tectonic shift in its technical structure. By clearing the critical levels that capped its advance for months, the asset leaves behind a quiet accumulation phase to directly threaten the macro bearish structure that dominated its price action.
Anatomy of the Momentum: From Range to Institutional Breakout
The bullish awakening from the support zone
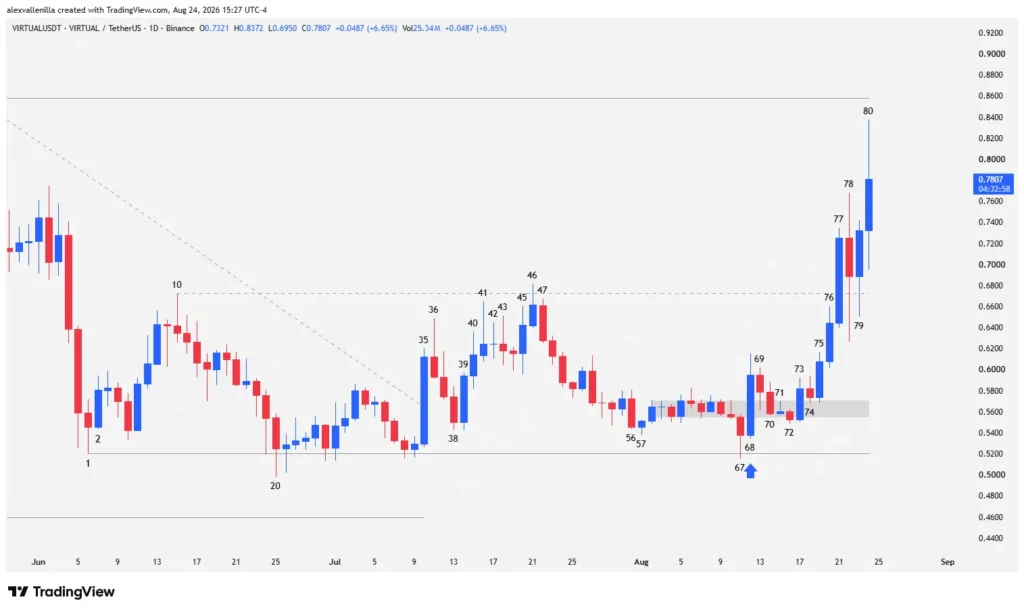
VIRTUAL’s recent structure takes shape around the millimeter-precise defense of the support located at $0.5204 (bar 1 low). Following the bearish breakdown failure of bar 69 and the seller trap at bar 72, buying pressure takes absolute control of the order book.
The definitive consecration of this dramatic pivot arrives with bar 77, a high-conviction candle that posts an impressive 12.56% surge. Backed by trading volume that nearly triples the 20-day moving average, this bar blasts through local resistance at $0.6728 (bar 10 high). This breakout is significant: it shatters the last relevant high of a secondary 64-bar bearish sequence and challenges a macro bearish structure that weighed on the token for the past 455 bars.
Extreme volatility and institutional validation
The impact of breaking a historical resistance triggers euphoria and subsequent profit-taking.
Bar 78: Volatility scales to extremes. Bears try to push the price back below the key level, but strong hands absorb the supply, turning the former resistance into a brand-new support via polarity inversion.
Bar 79: It acts as a tactical pause, a high-volatility inside bar with a pronounced lower wick that certifies firm rejection of lower prices.
Bar 80 (Ongoing): At the time of analysis, this bar confirms bullish continuation by surpassing the previous high. Although it prints an extensive upper wick upon approaching the $0.8577 barrier—the second major resistance from the previous structure—volume triples the daily average once again, highlighting high-voltage combat where institutional capital rotates and validates the current price zone.
VIRTUAL‘s price behavior evidences the definitive exhaustion of sellers after a prolonged macro bearish cycle. By consolidating the $0.6728 band as support and challenging the resistance at $0.8577, the token transitions from a sideways accumulation phase to a medium-term pre-bullish scenario. Strict reading of order flow and institutional volume confirms that demand absorbs every corrective market attempt with solvency.
Disclaimer: This article is for educational and informational purposes only and does not constitute financial advice of any kind. Crypto asset trading carries a high risk of capital loss. Always conduct your own research before investing.

Communications Professional. Crypto Enthusiast. Economic Journalist. Bitcoiner & Altcoiner.