LayerZero (ZRO) sits at a critical inflection point within its market structure. Following prolonged selling pressure that governed the asset for hundreds of sessions, price action on the daily chart reveals clear exhaustion from the bears, culminating in a breakout attempt above key resistance at $1.224 driven by unusual volume. This technical behavior exposes an order flow transition that traders and tech investors cannot overlook.
Anatomy of a Trend Reversal: From Bearish Exhaustion to Bullish Momentum
The asset dragged a primary bearish structure of 627 bars, within which a secondary trend of 141 bars developed. However, meticulous reading of the candlesticks helps understand how institutional supply began to lose strength at lower levels.
The Fakeout and Bearish Deceleration
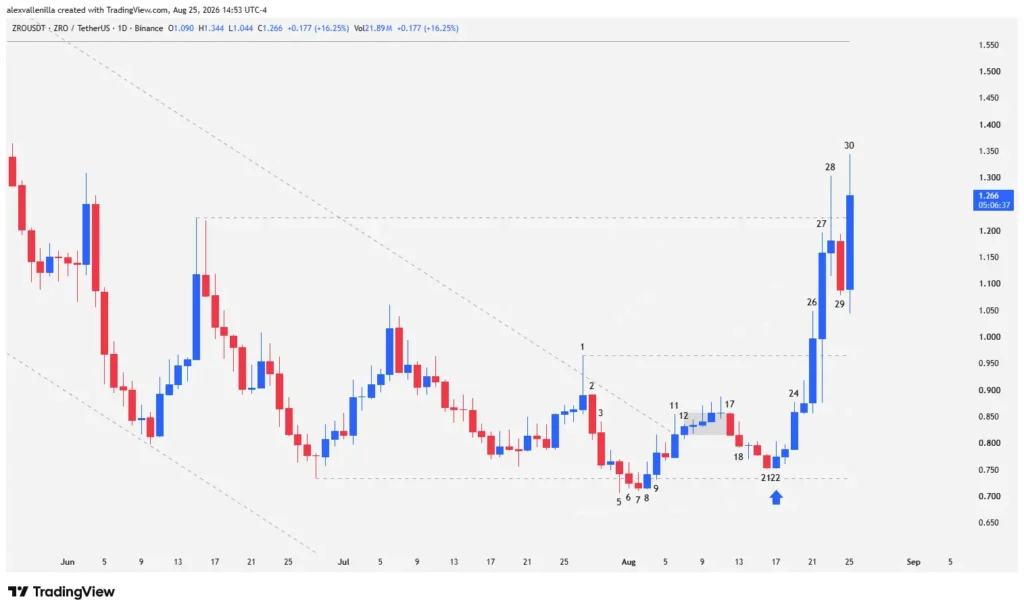
In bar 1, the bulls attempted to break a 141-bar descending trendline using an inverted hammer, but failed to secure a higher close, establishing initial resistance at $0.965. This gave way to bar 2, a high-conviction bearish candle seeking continuation of the drop.
However, the structure began to decelerate. Between bar 2 and bar 7, candle bodies grew progressively smaller, evidencing a loss of momentum among sellers. In bar 5, a breakdown attempt of support at $0.734 printed a low below bar 3, triggering automatic sell orders; nevertheless, the price closed above support, generating a failed breakout that betrayed the weakness of supply.
The Tweezzer Bottom and Bullish Reaction
The true defense of buyers formed in bars 21 and 22. Bar 22 practically repeated the exact same low as bar 21, setting up a tweezzer bottom pattern that left a slightly higher low than bar 5. This pattern at a key support zone acted as a buying catalyst.
Confirmation arrived with bar 24, a high-conviction bullish bar whose order flow began operating from the start of the session. Shortly after, bar 26 broke the $0.965 resistance (bar 1 high) with trading volume tripling the 20-day average, confirming absolute dominance from buyers.
The Fire Test at $1.224
Volatility spiked in bar 27 with a fierce battle reflected in its long lower wick, where buyers absorbed supply at the new polarity support. Although bar 28 attempted to surpass critical resistance at $1.224—the last relevant high of the 141-bar secondary bearish structure—with an inverted hammer and profit-taking, bar 30 (current) displays a dynamic scenario. This outside bar, with volume quadrupling the 20-day average and a large range expansion, temporarily places the closing price above $1.224, directly challenging the macro bearish structure.
Outlook and Key Trading Levels
The current rebound tests a fundamental resistance zone. If buyers manage to consolidate closes above $1.224, the path opens to target $1.557 and even challenge the macro structure in search of the secondary trend peak at $2.393.
Conversely, if the current breakout loses steam, any pullback finds its first validation zone and flipped support at $0.965. Strict price reading proves that supply is being absorbed, but definitive confirmation depends on how the current session closes.
Disclaimer: This article is for educational and informational purposes only and does not constitute financial advice of any kind. Cryptocurrency trading carries a high level of risk; always conduct your own research before committing capital to the markets.

Communications Professional. Crypto Enthusiast. Economic Journalist. Bitcoiner & Altcoiner.