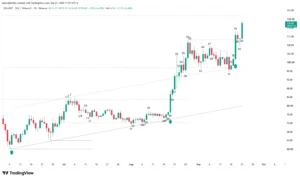
The PancakeSwap (CAKE/USDT) market ends a prolonged bearish cycle after validating critical support at $1.127 and initiating a solid bullish structure on the daily (1D) timeframe. Clearing the key $1.668 level confirms a Major Trend Reversal, while the recent expansion bar breaks out of a tight consolidation phase to project the token toward the $2.173 technical target.
Macro Regime Shift: From Selling Pressure to Buying Acceleration
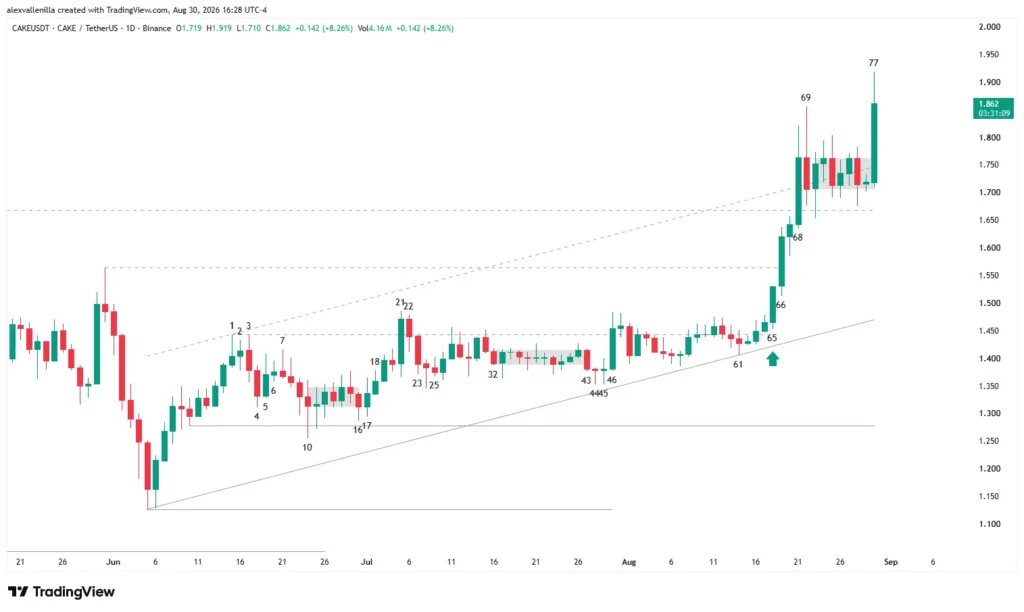
The CAKE/USDT pair transforms its market dynamics after overcoming a macro bearish structure that dominated the last 317 daily bars with a continuous sequence of lower highs and lower lows. Demand established a firm floor at $1.127, a level that served as the catalyst to build an 86-bar ascending channel supported by rising higher lows.
Buying pressure cleared the structural resistance zone between $1.565 and $1.668, completing the first Market Structure Shift. This move transformed the former overhead resistance area into high-reliability polarity support. During the prior expansion impulse, price experienced overshooting as it temporarily pierced the upper channel line, demonstrating clear demand dominance over supply.
Price Action Technical Analysis: Bar-by-Bar Narrative
Order flow behavior reveals a clean transition from the accumulation phase to the resumption of buying momentum.
- Building the Bullish Anchor (Bar 61)
Bar 61 prints a textbook Higher Low on the lower channel line. This candle acts as the structural anchor validating institutional presence and triggering the subsequent price acceleration.
- Momentum Confirmation and Bull Surprise (Bars 64 and 65)
Bar 64 forms a tactical pause under a High 2 trigger pattern. Bar 65 responds as a high-conviction Entry Bar / Bull Surprise, displaying a dominant green body that comfortably clears the prior high.
- Clean Trend Follow-Through (Bar 66)
Bar 66 sustains bullish Follow-Through without showing significant upper wicks. Price slices straight through the intermediate $1.565 resistance, confirming the absence of aggressive supply.
- Overshooting and Key Breakout (Bar 68)
This candle represents the expansive breakout of the $1.668 resistance and the upper channel line. Although the upper tail indicates partial Profit Taking, the close in the upper third confirms total control by buyers. - Horizontal Consolidation in Barb Wire (Bars 69 to 76)
Bar 69 re-enters price slightly back inside the channel. The 7 subsequent bars structure a micro congestion range with small bodies and overlapping wicks (Barb Wire / Tight Trading Range). This pause absorbs floating supply without losing the polarity zone between $1.700 and $1.668.
- Momentum Resumption (Bar 77 – Current)
Bar 77 emerges as a wide-range Bull Trend Bar. It breaks out of the Barb Wire formation and clears previous highs at $1.88 – $1.92. As a developing candle on the daily timeframe, it needs to confirm its close in the upper zone to validate immediate continuity.
Order Flow and Operational Setup
The imbalance created between bars 65 and 68 demonstrated sellers’ inability to push price back into the channel. The current breakout opens the door to a Measured Move equivalent to the height of the initial impulse.
| Technical Parameter | Price Zone | Price Action Rationale |
| Conservative Entry | Bar 77 Close (> $1.860) | Confirms the validity of the Barb Wire breakout. |
| Pullback Entry | $1.730 – $1.750 | Pullback to the top of the micro congestion range. |
| Strategic Stop Loss | $1.700 | Below the low of bar 76 and the base of the range. |
| Conservative Stop Loss | $1.565 | Below the key macro polarity shift level. |
| Main Target (TP1) | $2.173 | Measured Move projection. |
| Extended Target (TP2) | $2.300 – $2.500 | Upper structural liquidity zone. |
Market Scenarios
Primary Scenario (Bullish): A daily close for bar 77 near its highs confirms a direct projection toward $2.173.
Alternative Scenario (Breakout Failure): If bar 77 suffers severe rejection leaving a long upper wick (bearish pinbar) that closes inside $1.720 – $1.750, the asset will retest polarity support at $1.668 or $1.565 before resuming the bullish structure.
The Importance of Structural Breakouts in CAKE
Price action in PancakeSwap demonstrates how accumulation above key support levels can dissolve long-term bearish structures. Holding the $1.668 polarity level and the bullish resolution of the Barb Wire pattern place the asset in a favorable position to seek new liquidity levels in the medium term.
Disclaimer: This article is strictly for informational and educational purposes regarding price action technical analysis. It does not constitute financial advice, investment recommendations, or an offer to buy or sell digital assets. Conduct your own research before making financial decisions.

Communications Professional. Crypto Enthusiast. Economic Journalist. Bitcoiner & Altcoiner.